
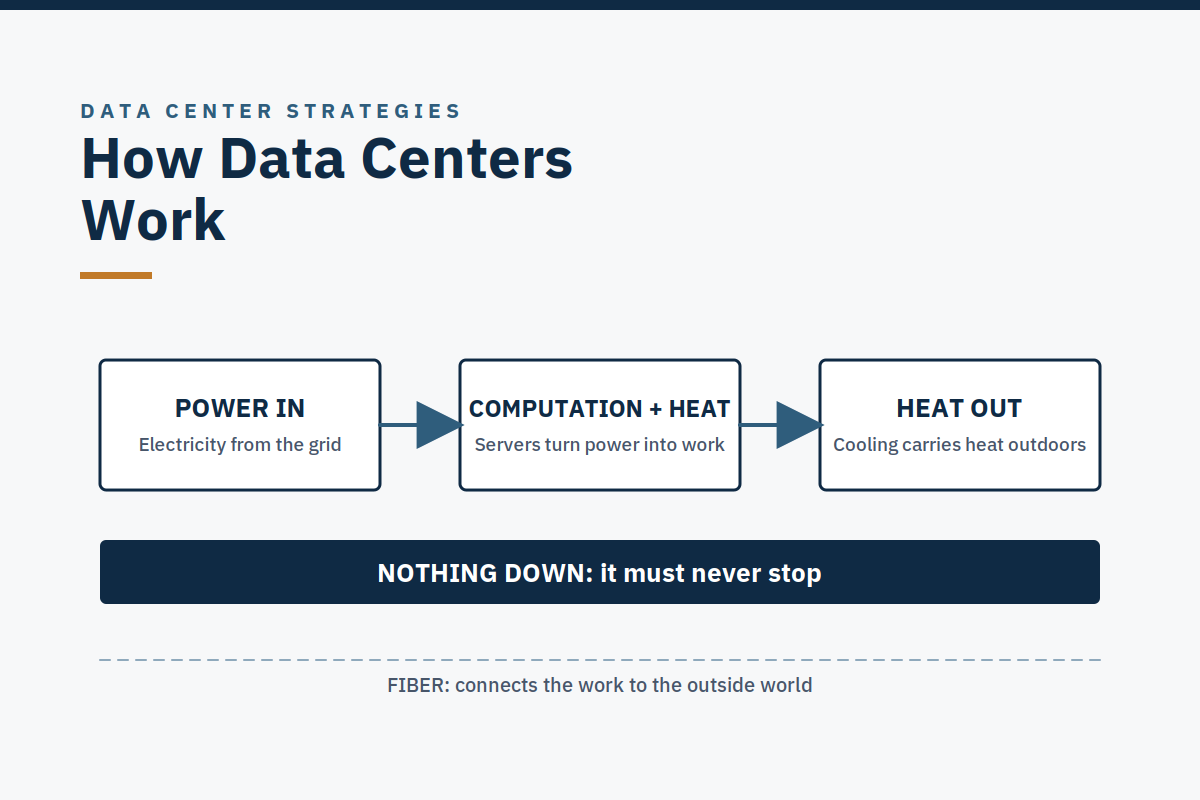
A data center does three jobs: take power in, turn it into computation and heat, and get the heat out, and it must never stop doing any of them. Power in, heat out, nothing down.
This page explains how that works, in plain language, in six short modules. Each module is built around one diagram. The diagrams are high-level and general. There is no one unifying design for a data center. The paths shown are common patterns and teaching archetypes, not a universal template, and real facilities deviate by operator, workload, age, climate, site, and generation. A deviation is not automatically a defect.
A data center is not a warehouse. It may have a warehouse-like appearance, but it is a working industrial facility. Its hierarchy, in order, is: campus → building → data hall → row → rack → server.
Who this is for: anyone who needs to understand a data center without an engineering degree, new operators, managers, students, business readers, and readers of Where AI Lives who want the grounding behind the book. No prior knowledge is assumed. No figures in this training are specifications; where a range is given, it is a reported range from public sources, not a universal specification.
Module 1: The one-sentence model: power in, heat out, nothing down
What the reader learns: the whole facility, in one sentence, and why "nothing down" is the hard part.
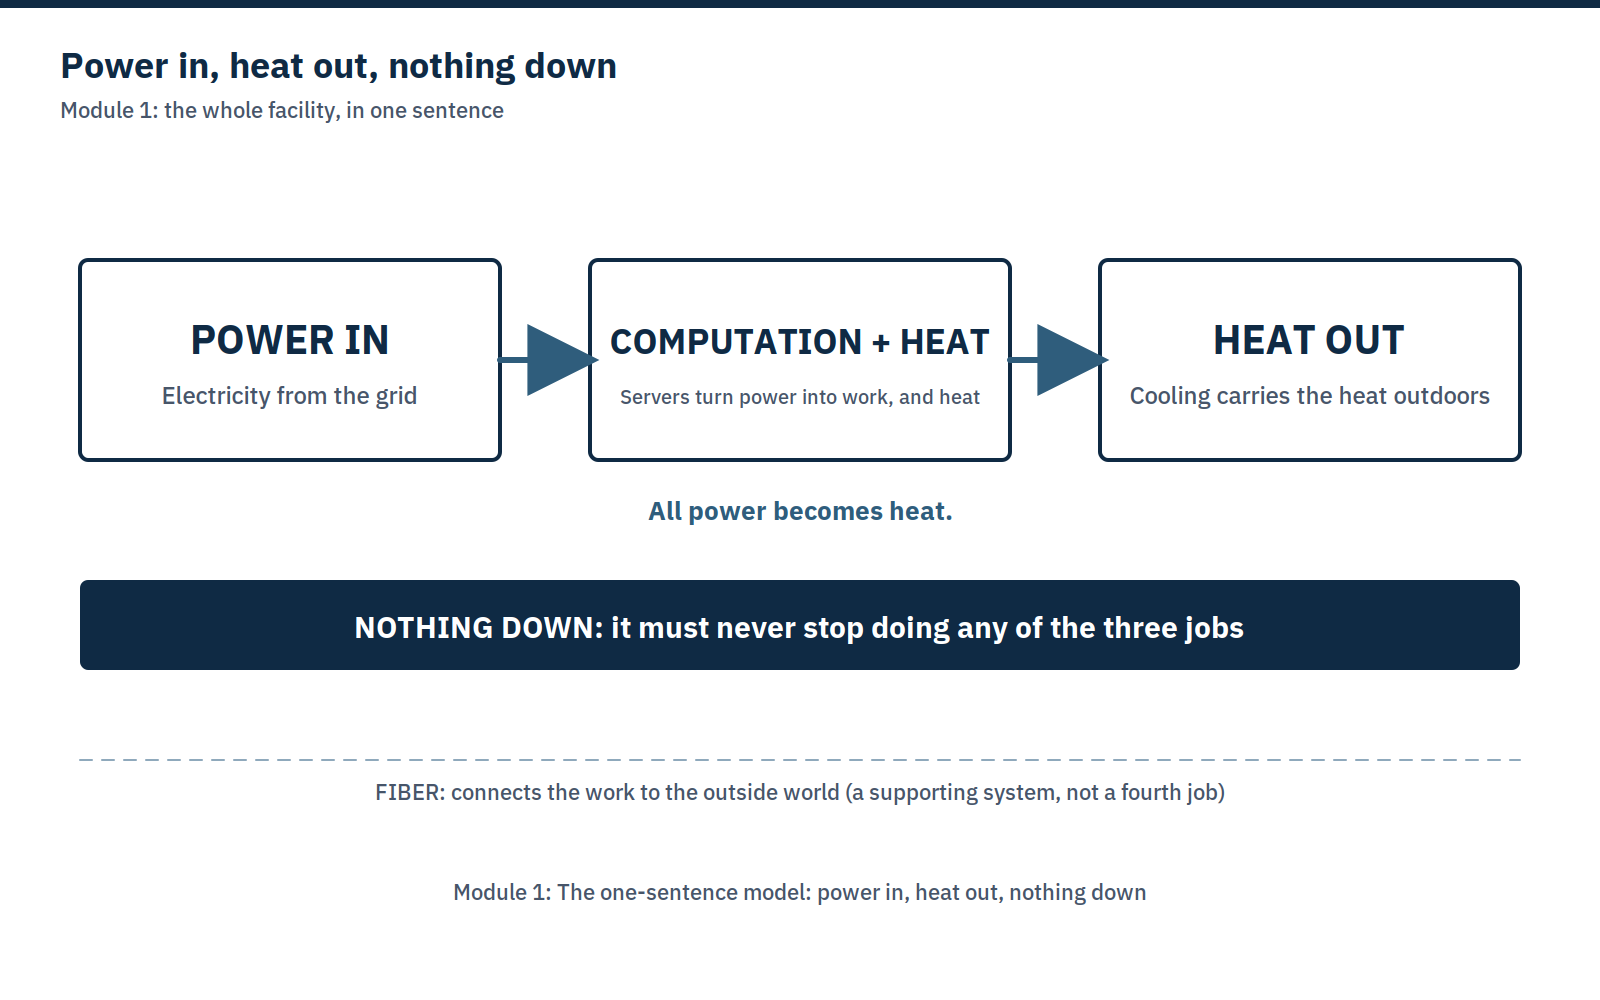
Everything in a data center serves those three jobs. Power comes in from the grid. Servers turn it into computation, and, unavoidably, into heat. Cooling carries that heat back outdoors. Fiber connects the work to the outside world; it is a supporting system, not a fourth job. And the facility must never stop doing any of the three jobs, not during a power failure, not during a cooling failure, not at 3 a.m. on a holiday. That "never stop" requirement is why data centers have duplicate paths, batteries, generators, and people on watch around the clock. It is also why operations matters as much as design: a facility can be designed to never stop and still stop, if the operations are not ready.
What to watch: If someone describes a data center by only one of the three jobs, only its power, only its cooling, only its servers, ask about the other two, and ask what happens when each one fails. A data center is the three jobs together, plus the promise that they never stop.
Module 2: The place: campus → building → hall → row → rack → server
What the reader learns: where the work happens, and the words to use for each level.
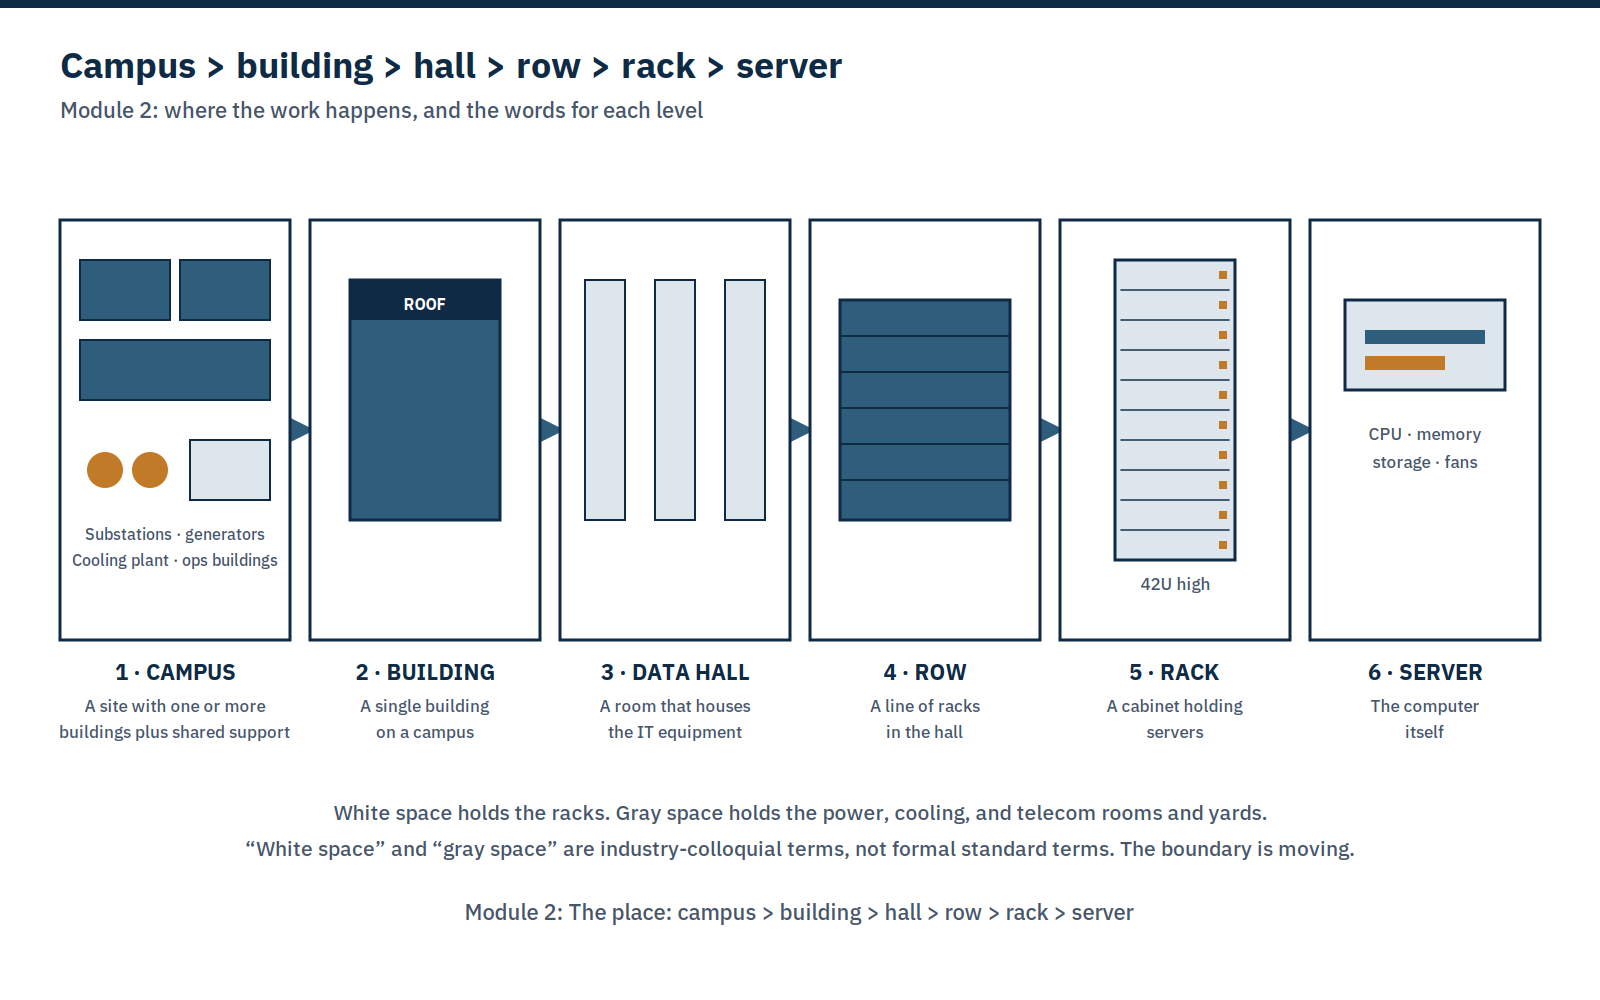
Say "campus" when you mean the site, "building" when you mean one building, "data hall" when you mean the room, "row" when you mean a line of racks, "rack" when you mean a cabinet, and "server" when you mean the computer. Mixing them up is how misunderstandings start, "the hall is hot" and "the rack is hot" are different problems.
A data hall uses either a raised floor (cool air through the under-floor plenum) or a slab floor (cooling from above or from in-row units), with hot/cold-aisle containment to keep cool supply air and hot exhaust air apart. Racks commonly use a 19-inch mounting-rail width in a cabinet about 600 mm wide and 1,070 mm deep, 42U high, though taller cabinets and heavier AI racks also exist, and high-density AI halls need heavier-rated cabinets and slab-on-grade floors, not standard raised floor.
What to watch: On a walk-through, ask which level you are standing in, and which level a problem is at. A hot server, a hot row, and a hot hall have different causes and different fixes.
Module 3: Follow the electron: the power path
What the reader learns: how electricity gets from the grid to a server, what the UPS and generator actually do, and why redundancy can be lost silently.
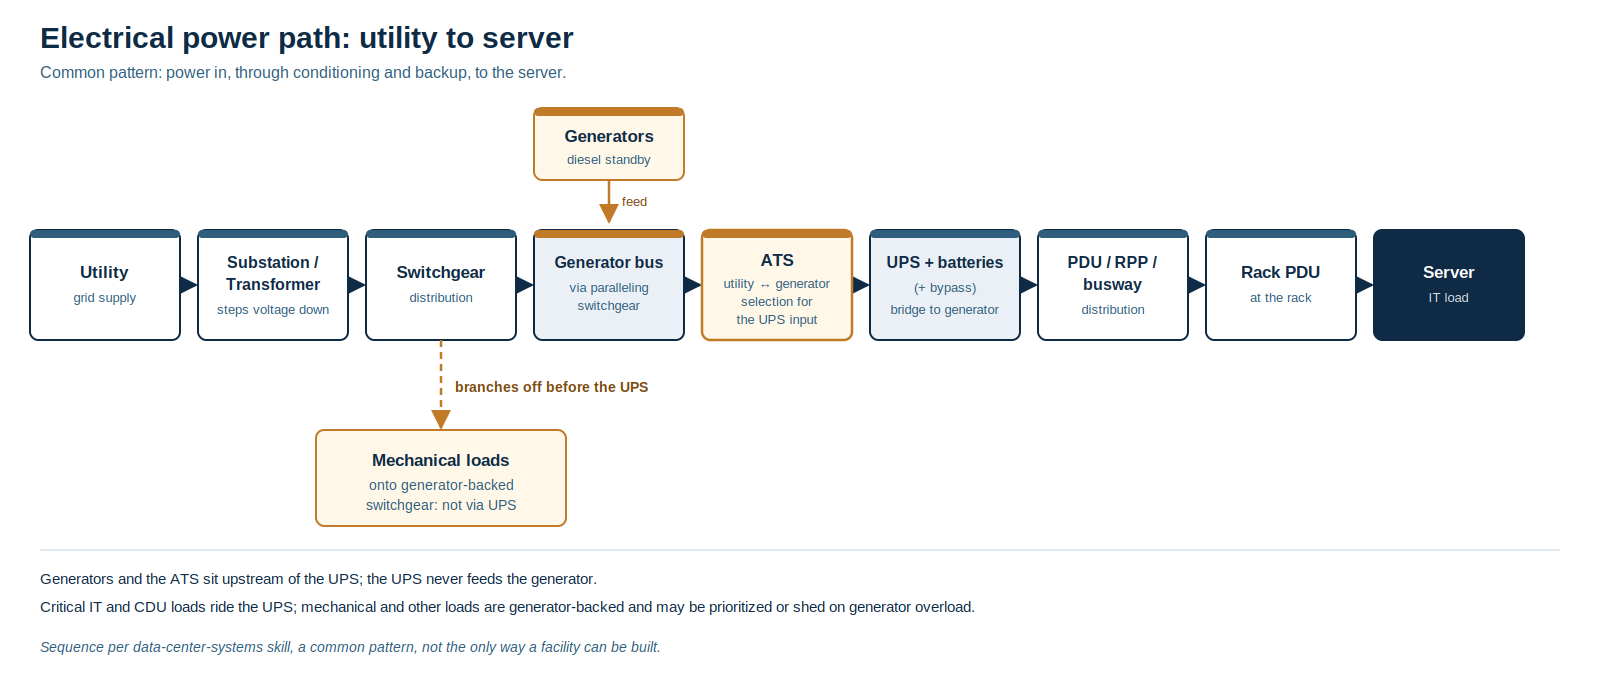
Follow the electron. Electricity arrives from the utility, is stepped down by transformers, and passes through switchgear to the automatic transfer switch, which selects between utility power and generator power. From there it goes through the UPS, the uninterruptible power supply, and its batteries, then through distribution (PDUs, remote power panels, busways) to the rack and the server. Generators and the transfer switch sit upstream of the UPS; the UPS never feeds the generator. The UPS is a bridge, not a long-term source: its batteries commonly give 5–15 minutes, enough for the generator to start and take the load (VERIFIED, commonly cited range, project-specific). Diesel generators are the dominant standby source. NFPA 110 Type 10 requires power at rated voltage and frequency at the load terminals within 10 seconds; the generator then accepts load in steps, rather than taking full load in 10 seconds (VERIFIED; NFPA 110, as summarized, no clause number asserted).
Redundancy is the part most often misunderstood. N means no spare. N+1 means one spare. 2N means a full duplicate. But redundancy is only real if three things are true: the topology supports it, commissioning proved it under an injected fault at design load, and operations has held it since. An N+1 plant in maintenance is just N, and a spare UPS does not help if both paths share one downstream panel, breaker, or cable route. That silent loss of redundancy is called redundancy erosion, and it is one of the most common ways a well-designed facility becomes fragile without anyone noticing.
What to watch: Ask "what is our redundancy right now, this afternoon, not on paper, but with everything in maintenance, bypass, or racked out?" If nobody can answer, the redundancy is not being held. Also watch battery age and temperature: batteries are commonly valve-regulated lead-acid (cited life about 3–5 years) or lithium-ion (cited calendar life about 10 years in UPS float service), and insulation ages faster when hotter (VERIFIED, commonly cited lives).
Module 4: The heat problem: cooling
What the reader learns: all power becomes heat; how cooling captures it, moves it, and rejects it outdoors; and why liquid cooling changes the speed of failure.
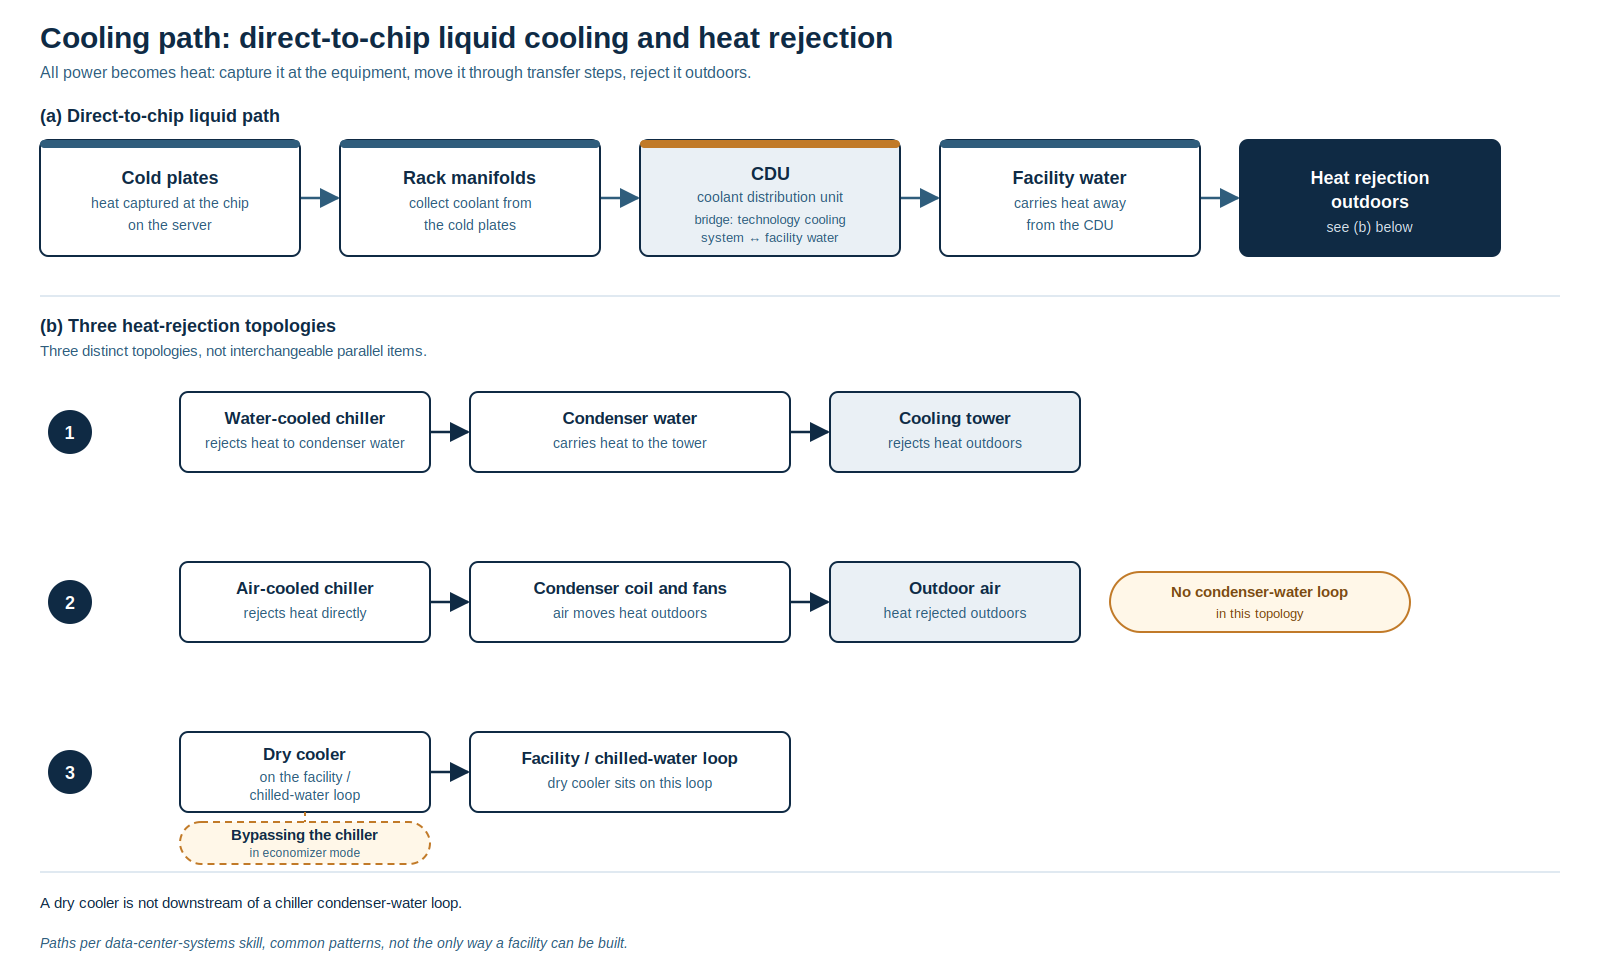
All power becomes heat, so cooling captures heat at the equipment, moves it through one or more transfer steps, and rejects it outdoors. In an air-cooled hall, air carries the heat to a cooling unit, chilled water carries it to a chiller, and the chiller rejects it outdoors, through a cooling tower, through an air-cooled condenser, or, in economizer mode, through a dry cooler that bypasses the chiller. Warmer facility water increases free-cooling hours, and the ASHRAE TC 9.9 recommended server-inlet air range for classes A1–A4 is 18–27 °C (VERIFIED; ASHRAE TC 9.9, Thermal Guidelines for Data Processing Environments).
In a direct-to-chip liquid-cooled hall, cold plates sit on the chips, a coolant distribution unit bridges the technology cooling system and the facility water system, and facility water carries the heat outdoors. Coolant is typically deionized water or a water/propylene glycol mix, and its chemistry, conductivity, and inhibitor treatment are operational requirements, not set-and-forget choices. The liquid share is typically 70–80% liquid, 20–30% air (VERIFIED, range, platform-dependent).
The failure speeds are different, and that matters. In an air-cooled hall, temperatures rise gradually, servers throttle, then shut down. In a cold-plate liquid-cooled hall, chip thermal limits can be reached in seconds (VERIFIED; Uptime Institute, "much less than a minute"). Thermal energy storage alone does not cover chip-level ride-through; UPS-backed technology-cooling-system pumps and CDU controls are the mitigation. Uptime's Continuous Cooling paper states Tier IV is the only Tier that requires continuous cooling, while recommending it above 4 kW per rack regardless of Tier (VERIFIED; Uptime Institute, Continuous Cooling paper).
Cooling ladders (labeled, design-dependent, thresholds are design-, airflow-, and vendor-dependent): routine air 12–15 kW per rack; contained air 20–30 kW; rear-door heat exchanger 25–40 kW typical, up to ~80 kW per Vertiv (VERIFIED); in-row 35–50 kW; direct-to-chip above about 40–60 kW depending on design.
What to watch: In a liquid-cooled hall, watch coolant chemistry, pressure, flow, and leak detection, and watch them as trends, not single readings. ASHRAE TC 9.9's May 2026 bulletin warns that direct-to-chip loops can drift invisibly at commissioning and surface as damage months later (VERIFIED; ASHRAE TC 9.9, May 2026). In any hall, watch for the seasonal transition: what integrated systems testing cannot fully simulate, the first summer or winter at real load will reveal.
Module 5: The nervous system: controls, monitoring, and alarms
What the reader learns: monitoring is not control; who operates what; why too many alarms is a failure mode; and what happens when the supervisor goes away.
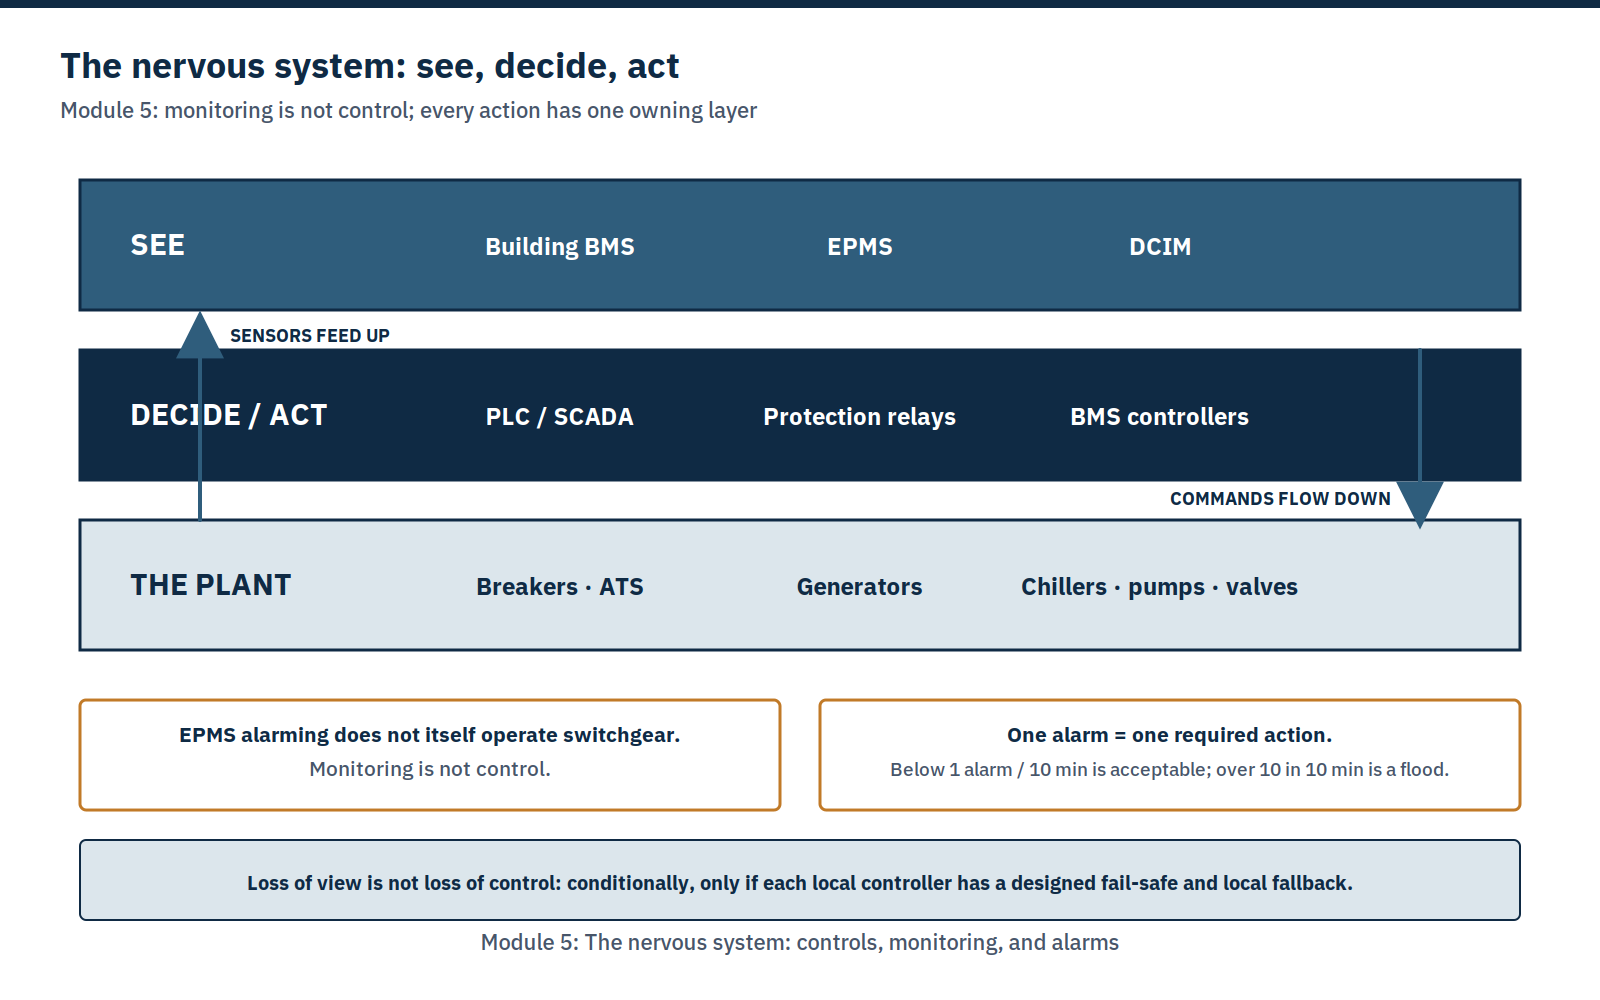
A data center's nervous system is its controls: sensors, controllers, and the software that ties them together. The operator's problem is often too much information, not too little. Monitoring is not control: a sensor reading is monitoring; a controller changing a fan, valve, breaker, or generator state is control. The building BMS monitors and controls mechanical and environmental systems. EPMS measures the electrical system. SCADA is supervisory monitoring and control of industrial processes, often above PLCs, use SCADA/PLC where fast deterministic control or electrical switching is required, and building BMS where HVAC sequences suffice. Classic DCIM relates facility capacity to racks and planning, and normally observes and reports rather than directly controlling chillers or breakers. (That boundary is dissolving in 2026 as unified operations platforms combine BMS, EPMS, and SCADA in one system, so name which layer owns each actuation in any given deployment.)
Alarm discipline is governed by ISA-18.2 and EEMUA 191 / IEC 62682. Every alarm must require a specific operator action within a defined time: one alarm equals one required action. Acceptable steady state is below one alarm per ten minutes per operator; a flood is more than ten alarms in ten minutes (VERIFIED; ISA-18.2 and EEMUA 191 / IEC 62682, as summarized, no clause numbers asserted). That needs an alarm philosophy, rationalization, and bad-actor review, rather than more alarms alone.
And a single shared control system can be a common-mode failure: duplicated power equipment controlled by one PLC pair can be affected on both sides at once by one wrong command (VERIFIED, design principle and analytical warning). Loss of view need not mean loss of local control, but only if each local controller has a designed fail-safe and local fallback. Sequences that live only at supervisory level, chiller staging, load-shed, lead-lag rotation, are lost with the supervisor. Name the fallback for every loop, and prove it in integrated systems testing.
What to watch: Trend over alarm, look at rate-of-change and deviation on trended data, rather than only at whether an alarm has fired. And ask, for every control loop: "If the supervisor dies, what does this device do?" If the answer is "hold last position", ask whether holding is safe, it often is not. The correct behavior is a designed fail-safe per device.
Module 6: The people on watch: shifts, procedures, and drills
What the reader learns: the facility is operated by people, in shifts, following procedures, and the procedures are the difference between a bad day and an outage.
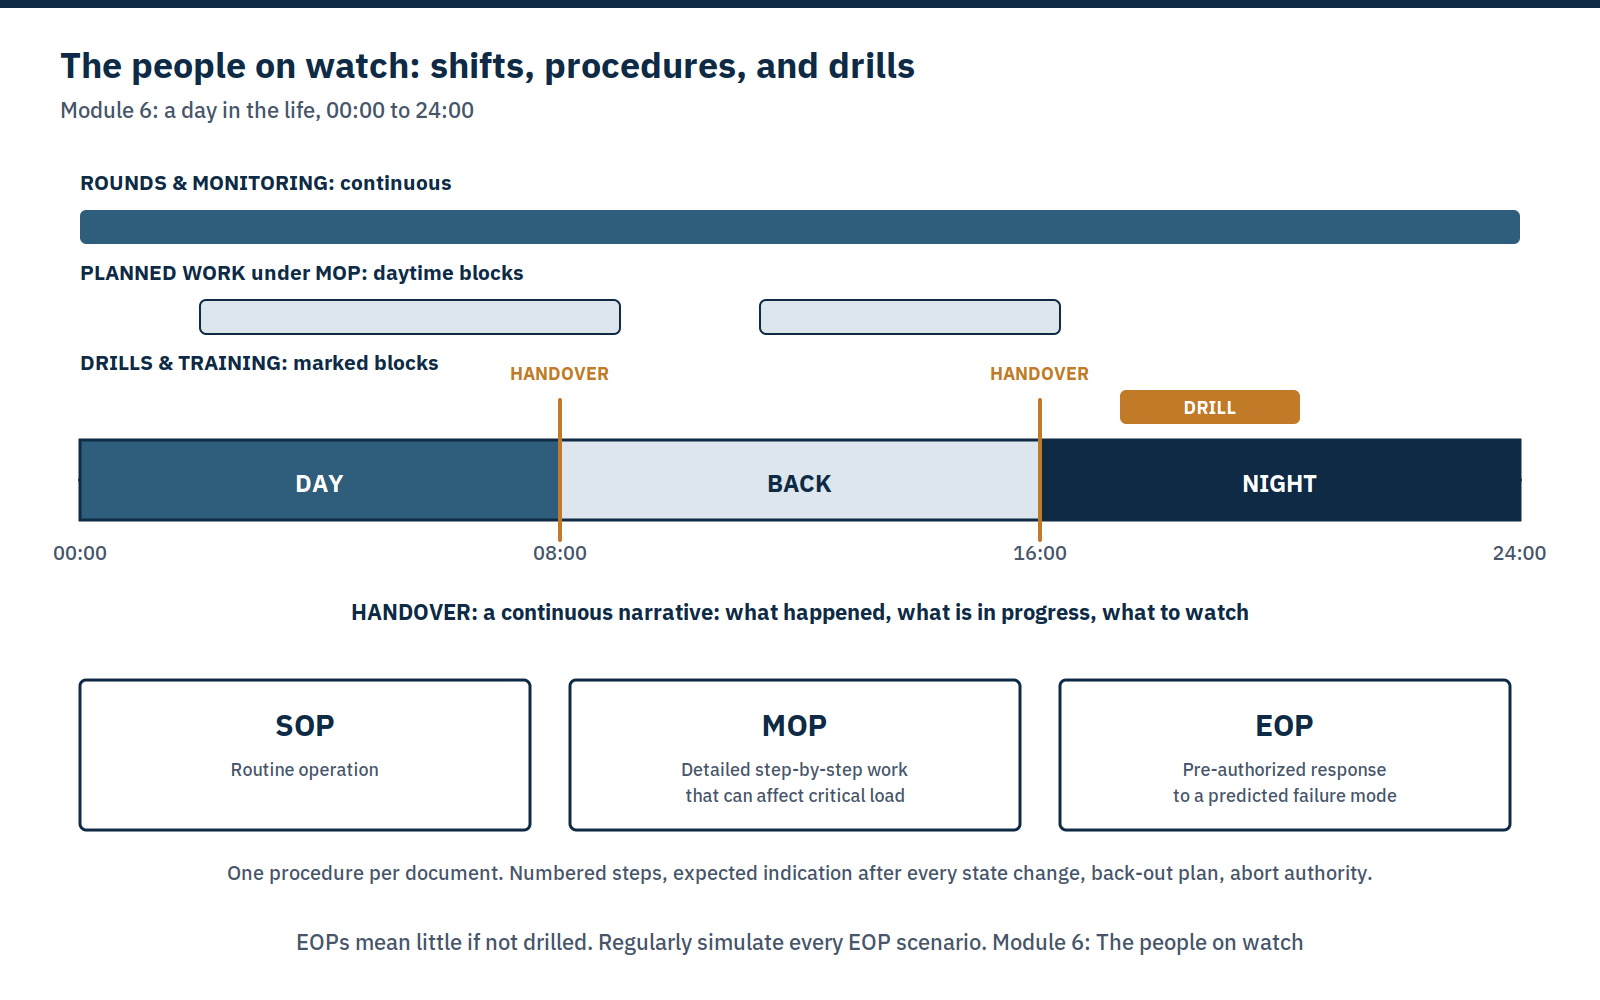
No data center runs itself. It is run by people, in shifts, around the clock, following procedures, and the procedures are the difference between a bad day and an outage. Three kinds of procedure matter. An SOP is routine operation. A MOP is detailed, step-by-step work that can affect critical load. An EOP is a pre-authorized response to a predicted failure mode, loss of power, loss of cooling, fire. One procedure per document, with numbered steps, an expected indication after every state change, a back-out plan, and abort authority.
Shift handover is where risk is transferred. A good handover is a continuous narrative the incoming crew can use to determine everything of consequence that occurred: alarms, work in progress, equipment in maintenance or bypass, and what to watch. In Uptime's Annual Outage Analysis 2026 (May 2026), failure to follow established procedures was the leading driver of human-error outages at 59% (VERIFIED; Resiliency Survey 2026, n=199). That is why EOPs must be drilled as well as written: walked in the field after energization, simulated regularly, and reviewed after every incident without blame.
Staffing is a safety matter. Sustained overtime at or above 10% correlates very strongly with increased incident rates, according to Uptime Institute guidance (VERIFIED, practitioner guidance, Uptime Institute, Top 14, February 2021). Who is authorized to do what, on which system, under which procedure, and how that is evidenced, is the authorization matrix, and it is as much a part of the facility as the switchgear.
What to watch: At any handover, ask three questions: What changed on this shift? What is still in progress or in bypass? What should the next shift watch first? If the answers are vague, the handover has not transferred the risk. And ask when the EOPs were last drilled in the field, not only read.
After the six modules
You now have the model: power in, heat out, nothing down, in a place with six levels, along a power path and a cooling path, watched by a nervous system, and operated by people on shift. The guides on this site go deeper into each part: procedures, change management, incident response, shift handover, and the transition from construction to operations. Browse the guides →. The pillar guides are Data Center Operations and Hyperscale Data Centers.
About the book that explains this in full → | About transition-to-operations help →
Scope
Scope: general guidance material that explains how a data center works. The ranges given are reported ranges from public sources, not specifications for any facility, and nothing here directs work on live critical plant.