
Drawn from the author's operating experience. Client details are anonymized.
Data Center Strategies: Inside Hyperscale series Author: Scott Stillings
The point of this case, in one paragraph
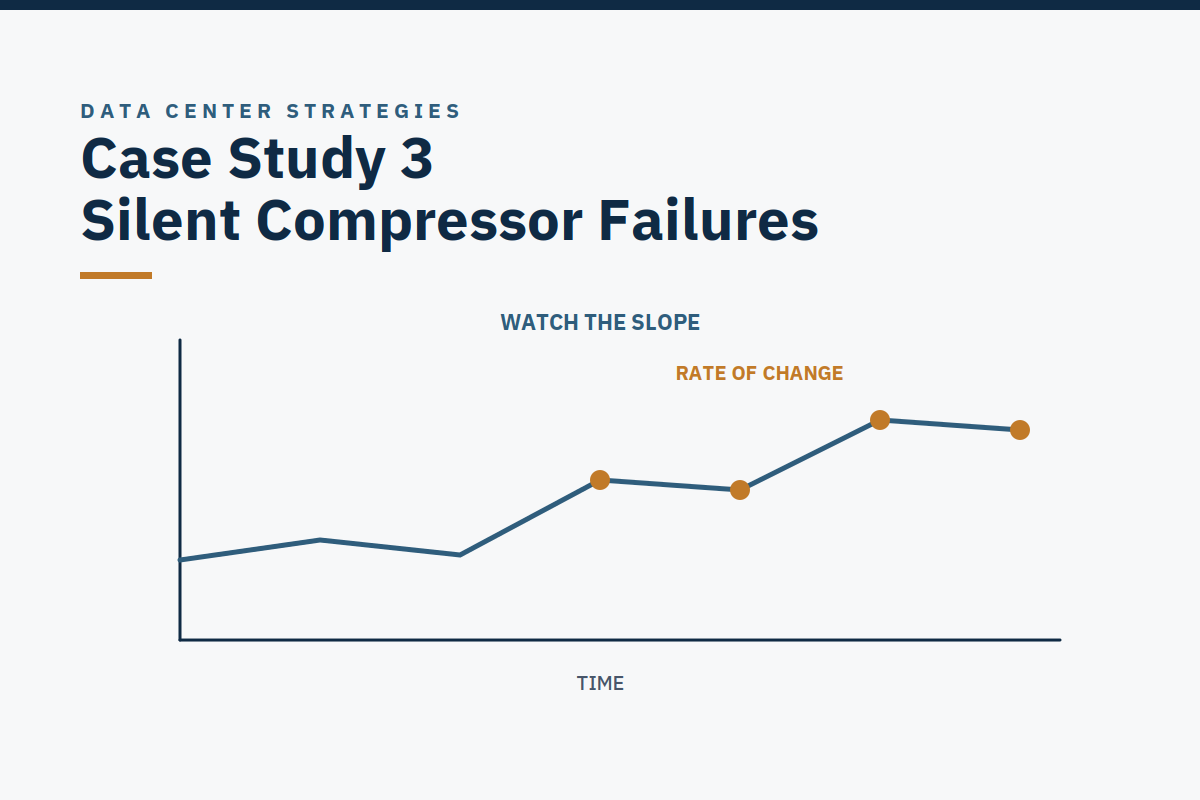
A chiller compressor can fail, recover, and fail again five or six times a day without ever raising an alarm. The failure is too brief and too small for the alarm to see. This case is about the failure mode that alarm-based monitoring cannot catch, and the older discipline that can. That discipline is watching trends against a baseline. A small change in chilled-water supply temperature was the only clue, and a deviation was treated as a finding before it became an alarm.
No downtime figure, cost saving, or efficiency improvement is claimed for this case, because none was measured in a form that can be published. What is recorded here is qualitative: what the plant did, how the team found it, and what changed in how the team worked.
1. Situation
The facility's cooling plant was built around four chiller plants holding eight compressors between them, two compressors per plant [Author's account]. The plant was in its first year of operation: the period in which commissioning has ended, the construction team has left, and the operating team is learning, under load, how the plant actually behaves as opposed to how the commissioning record says it behaves.
Three features of the situation made this failure mode possible:
- The plant had thermal mass to spare, and that was the problem. A large volume of chilled water sits between the chillers and the load. That volume is a buffer: a brief loss of cooling is absorbed by it, and the chilled-water supply temperature moves only slightly before the plant recovers. A buffer that absorbs a failure also hides it.
- The alarms were set for the failure the designers expected. The loss-of-cooling alarm setpoint was set for a sustained loss of cooling large enough to threaten the load. A compressor that stops and restarts within seconds never produces a sustained excursion, so it never reaches the setpoint. The alarm system was working as designed; it was designed for a different failure.
- The team was new to the plant, and the plant was new to everyone. No operator had a year's worth of this plant's trends in their head yet. "Normal" was still being established from the plant's own data, which meant that a small, repeated deviation was easy to dismiss as noise, until someone decided to look at it as a signal instead.
2. What was found
The findings below are the author's account of the facility, stated as recorded. No site, employer, date, or measured result is given, and no figure in this section is a measured outcome beyond the counts the account records.
Finding 1: Compressors were running back to zero and restarting, silently. One or both compressors in a unit would run back to zero and restart within seconds [Author's account]. The loss of cooling was real, the compressor had stopped delivering, but it was brief, and the plant recovered before the loss-of-cooling alarm setpoint was reached. There was no alarm, no event log, and no BMS/HMI record of the event [Author's account]. As far as the control system was concerned, nothing had happened.
Finding 2: The large chilled-water volume masked the loss. The volume of chilled water in the system absorbed the brief loss of cooling, so the chilled-water supply temperature moved only slightly [Author's account]. The only clue was small changes in chilled-water supply temperature, changes small enough to be read as noise by anyone watching the alarm screen, and large enough to be a finding to anyone watching the trend.
The masking was not a defect in the plant. It was the plant doing what a large thermal mass does. The defect was in the monitoring: a system that only notices a failure when it is large enough to alarm will never notice a failure that is small enough to be absorbed.
Finding 3: It was happening five to six times a day. Once the team started looking for it, they discovered five to six such silent failures a day across the eight compressors [Author's account]. That is 35–42 silent failures a week [ESTIMATE, 5–6 a day × 7 days; the account records the daily rate, not a weekly log].
None of them had raised an alarm. The rate matters because it reframes the failure: this was not a rare event that happened to escape notice. It was a routine event that the monitoring was structurally blind to, happening roughly every few hours, every day, with no record anywhere except in the trend an operator happened to be watching.
Finding 4: When a restart took too long, the plant pointed at the wrong system. Sometimes a restart took longer than the usual few seconds. In those cases the unit tripped on low oil differential pressure [Author's account]. The oil pumps were shaft-driven, driven by the compressor shaft itself, so while the compressor was stopped or turning slowly during the restart, the oil pump was not producing full pressure, and the oil differential pressure fell [Author's account]. The trip looked like an oil-system fault.
It was not. It was a consequence of the restart taking too long, and the restart taking too long was a consequence of the silent failure. The visible symptom pointed at the oil system; the cause was the compressor's stop–restart behavior. Any investigation that started from the trip and stopped at the oil system would have fixed the wrong thing, or, more precisely, would have found nothing wrong with the oil system and concluded that the trip was unexplained.
Finding 5: The failure was invisible to every record the site kept. No alarm, no event log, no BMS/HMI record [Author's account]. That is worth stating plainly, because it is the finding that generalizes. A site that measures its reliability by counting alarms would have counted zero failures. A site that measures its reliability by reading trends would have counted five or six a day. Both sites would have been looking at the same plant.
3. What was done: the method
Method numbers in this section, the 27 Gate checks, the score bands, the 7-day review window, the Top-10 list, are the consultant's own method, not verified facts.
The method that found this failure is the method of Chapter 7 of the author's book: reliability is day-to-day attention to detail, trend, anticipation, and condition-based response [Author's account, the author's stated method]. It is not a piece of equipment and not a software purchase.
It is a way of watching a plant, and it is the same discipline the author applies to a dry cooler fouling over a dusty summer: watching the subtle trends in approach temperature and heat-exchanger temperature difference, catching the slow drift long before it becomes a capacity problem or an alarm. The compressor case and the dry-cooler case are the same lesson in two forms, one fast and repeated, one slow and seasonal, and the method that catches both is identical.
3.1 Trend, not only alarm-watch
The first step was to stop treating the alarm screen as the plant's state and to start treating the trend as the plant's state. The team watched the chilled-water supply temperature as a trend against the plant's own baseline, the normal established by this plant's data in its actual modes, rather than waiting for a threshold to be crossed.
A small, repeated rise in supply temperature, recovering each time, is a finding when it is seen as a trend. It is noise when it is seen as a single reading. The difference between the two is not the data; it is the habit of looking at the data over time.
3.2 Compare the controlled variable against its setpoint, and against its sister unit
A single compressor's behavior is hard to judge in isolation. The method compares the controlled variable against its setpoint and against the sister unit doing the same job under the same load [Consultant's method. Operational Efficiency & Procedure Review]. If one of two compressors in a plant shows a repeated small excursion in supply temperature and the other does not, the difference is the finding, and it is a finding that survives even when the absolute change is small. Sister-unit comparison is what turns "the temperature moved a little" into "this compressor is behaving differently from its twin."
3.3 Check calibration before changing a setpoint
Before any setpoint was touched, the method requires checking sensor calibration first [Consultant's method. Operational Efficiency & Procedure Review]. A small change in a reported temperature can be a real change in the plant or a drifting sensor, and changing a setpoint on the strength of a drifting sensor makes the plant worse while appearing to fix the reading. Any setpoint change that did follow went through change control, with a reason, an authorizer, and revert criteria recorded, the same setpoint discipline the efficiency review applies to any cooling change.
3.4 Treat the misleading trip as a symptom, not a cause
When a unit tripped on low oil differential pressure, the method was to ask what had happened immediately before the trip, not only what the trip said. The shaft-driven oil pump meant low oil pressure was the expected consequence of a slow restart, so the trip was investigated as a symptom of the stop–restart behavior rather than as an oil-system fault in its own right.
This is the discipline of asking "what in the procedure, the training, or the plant made this the likely outcome?" rather than accepting the first label the plant offers. A trip that points at the wrong system is worse than no trip at all if it is believed, because it closes the investigation in the wrong place.
3.5 Log what the control system does not log
A failure with no alarm, no event log, and no BMS/HMI record has to be logged by hand, or it does not exist for the purposes of the site's own learning. The method records each silent failure found in the trend, time, compressor, what the supply temperature did, and how long the recovery took, building the record the control system had not built.
That manual log is what turns a suspicion into a rate: five to six a day [Author's account]. Without it, each event would have remained a single observation, and a single observation is always dismissible. A log of thirty-five to forty-two events a week is not.
3.6 The procedure method, applied to this finding
The detection above is the front half of the Operational Efficiency & Procedure Review method; the back half is what makes the finding stick in the procedure library [Consultant's method, the procedure method]:
- Baseline first. No recommendation without a baseline: the plant's normal supply temperature, its normal approach temperatures, and its normal alarm rate, per system and per mode.
- Observe. Attend rounds and a shift handover; watch the BMS view as the operators actually use it; sample the alarm log for floods and bad actors. In this case, the observation that mattered was that the operators' view showed a healthy plant while the trend showed a failing one.
- Test one variable at a time. Recommend the site change one variable, measure for a defined period, compare against the baseline, and revert if it does not help. A lever that cannot be measured is not recommended.
- Report with a revert plan. Each recommendation states the change, the expected effect (labeled ESTIMATE unless measured), the measurement that would prove it, the risk, the revert plan, and the owner. No recommendation is stated as a guaranteed saving.
- Rationalize the alarms. The finding that five to six real failures a day produce zero alarms is an alarm-rationalization finding: the alarm set is missing a rate-of-change or deviation alarm on the trended variable.
- The method is to measure the alarm rate, list the bad actors, and for each alarm decide whether it requires action (keep it, linked to the procedure that acts on it), is an indication only (demote it to an event or trend), or is a defect (fix the plant or the instrument, not the alarm). An alarm is never silenced by deleting it; suppression is governed, time-limited, and logged.
- Write it down so the next shift can see it. The procedure library, the shift handover, and the failure log are the mechanisms by which a finding held by one operator becomes knowledge held by the team. A discovery that lives only in one person's head is one resignation away from being undiscovered again.
One boundary is stated plainly here, because it is the boundary the case turns on: the account records the discovery of the silent failures, and the method above. It does not record a named root-cause fix, a vendor action, or a measured result after a fix. This case study does not invent one. The lesson is in the detection and the discipline, not in a repair that is not in the record.
4. Outcome, as recorded in the author's account
This section reports only what the author's account records, in qualitative terms. No measured outcome is claimed. There is no PUE figure, no downtime figure, no cost-saving figure, and no percentage improvement in this case study, because none is available in publishable form, and inventing one would mislead the reader about what trend-watching can prove.
What the account records is:
- Eight compressors across four chiller plants, with one or both compressors in a unit running back to zero and restarting within seconds [Author's account]. The scale of the plant is the point: this was not one faulty compressor. It was a behavior spread across the plant.
- Five to six silent failures a day, discovered once the team started watching the trend [Author's account], 35–42 a week [ESTIMATE, 5–6 a day × 7 days]. The discovery did not change how often the failures happened. It changed how often they were seen: from never to five or six times a day.
- No alarm, no event log, and no BMS/HMI record for any of them [Author's account]. The alarm count for these failures was zero, and it stayed zero for as long as the monitoring depended on thresholds the failures never reached.
- When a restart took too long, the unit tripped on low oil differential pressure [Author's account], a misleading symptom, because the shaft-driven oil pumps produced low pressure as a consequence of the slow restart, not as an independent oil-system fault. The trips that did appear pointed away from the cause.
- The only clue was small changes in chilled-water supply temperature [Author's account]. That is the whole of the detection story, and it is the whole of the lesson: the signal was there, in a variable the team was already recording. It was not found by new instrumentation. It was found by looking at existing data with a different question in mind.
What did not happen, as far as the account records, is equally important: the account does not record a measured improvement in any performance metric after the discovery, and this case study does not claim one. Finding a failure is not the same as fixing it, and a team that can now see five failures a day is not the same claim as a plant that has five fewer failures a day. The two should not be conflated, and the honesty of this case depends on keeping them apart.
5. What changed afterwards
The changes below are changes in how the team worked, following from the discovery and from the Chapter 7 method, attention to detail, trend, anticipation, and condition-based response. They are working-practice changes, not measured performance results, and no figure is attached to any of them.
- Trends replaced alarms as the first line of attention for this plant. The supply temperature trend, reviewed against the plant's own baseline, became a routine part of rounds and shift handover, not a special investigation. A deviation from baseline became a finding before it became an alarm, because in this case the alarm never came at all.
- Sub-alarm events got a log of their own. Failures the control system did not record were recorded by hand, with time, compressor, and what the trend showed. That log is what made the rate visible, and the rate is what made the failure impossible to dismiss as a one-off.
- The oil-pressure trip was reclassified in the team's thinking. A low-oil-differential-pressure trip after a slow restart is now read as a possible symptom of the stop–restart behavior, not as a standalone oil-system fault. The investigation starts one step earlier: what happened before the trip.
- Sister-unit comparison became the default check. When one compressor behaves differently from its twin under the same load, the difference is investigated, even when both are inside their alarm limits. "Inside limits" stopped being treated as "healthy."
- Setpoint discipline tightened. Calibration is checked before a setpoint is changed, and every change goes through change control with a reason, an authorizer, and revert criteria. A setpoint changed on the strength of an unexamined reading is how a small problem becomes a larger one.
- The same discipline was applied to slow drift, not only fast events. The dry-cooler example is the other half of the method: over a dusty summer, a dry cooler fouls gradually, and the approach temperature and heat-exchanger temperature difference creep upward long before capacity is threatened. Watching those trends is the same skill as watching the supply temperature for a silent compressor failure, trend, anticipation, and condition-based response, applied on a seasonal timescale instead of a timescale of seconds.
- The first year ended with the team knowing what it still did not know. Failure modes that had never been seen, control sequences tested only at partial load, and alarm gaps still open were listed as residual risks, not assumed to be resolved. That list, not a claim of completion, is the honest output of a first year.
6. Research and context: why this case matters beyond one facility
This section is industry context from published sources, labeled per figure. It is not a description of the facility in this case, and its figures must not be read as results for that facility.
The human and procedure share of outages is rising, and this case is a procedure-and-monitoring failure, not a component failure. In Uptime’s 2026 analysis, 92% of respondents said human error was at least a minor contributor to their most recent impactful outage [VERIFIED, Uptime Institute, Annual Outage Analysis 2026, May 2026, Fig. 13, Resiliency Survey 2026], and failure to follow established procedures was the leading driver of human-error outages at 59% (n=199) [VERIFIED, same source, Fig. 14].
In Uptime's 2026 analysis, failure to follow established procedures was the leading driver of human-error outages at 59% (n = 199) [VERIFIED, Uptime Institute Annual Outage Analysis 2026, May 2026].
For Category 3–5 outages, 87% of operators believe better management and processes would have prevented their most recent incident, on the Uptime survey's own base [VERIFIED, Uptime 2025 survey PDF for the 87% figure, different base]. The silent compressor failure is the same story one step earlier: the procedure that mattered was the monitoring habit that was missing entirely. Nobody had been asked to watch the trend.
Cooling failures are a minority of outages, but they cascade. Cooling accounts for about 13% of most-recent impactful outages [VERIFIED, ComputerWeekly reporting of Uptime Institute Annual Outage Analysis 2025; base is respondents' most recent impactful outage]. The mechanism that makes that minority dangerous is the cascade: loss of cooling leads to overheating, which leads to server throttling and then shutdown. In a cold-plate hall, chip thermal limits can be reached in seconds once flow or cooling is lost, so a cooling failure that is caught late is caught too late.
The figure sometimes cited for how fast throttling can follow a CDU pump failure, as little as 23 seconds, is a single cited case, not a general figure [VERIFIED for the seconds-scale claim; the 23-second figure is a single cited case, not a general rule].
The silent compressor case is the benign version of the same mechanism: the failures were brief enough to be absorbed, so the cascade never started. A longer version of the same failure, on a hotter day, at higher load, would not have been benign, and the team would have had no warning, because the warning system had never seen the short version.
Chiller tuning and calibration problems are a recognized first-year failure mode. Control sequences that were never exercised at real load, at steady-state temperature, under the actual operating profile do not behave as the commissioning record suggests [VERIFIED, research report, §4.2 and §4.6; Ethyco on control sequences not matching design intent].
Commissioning cannot fully simulate seasonal variation, real IT load profiles, or the control drift that appears once a loop reaches steady-state temperature under heavy load. That is the structural reason the first year produces the failures it does, and the reason the first-year watch exists as a service. The silent compressor failures belong in that catalogue alongside chiller tuning: a first-year behavior that commissioning did not, and in this form could not, have shown.
Alarm floods and missing alarms are two sides of the same problem. A single fault can generate dozens of alarms, burying the initiating event; a real fault can also generate none, as this case shows. The discipline is the same in both directions: one alarm should mean one required action, and every alarm that can fire should have a named procedure or a named "no action, monitor" disposition.
The rate-of-change and deviation alarms on trended data, the alarms this case was missing, are the specific remedy for failures that are too brief or too small for a threshold alarm. Alarm rationalization is therefore not only about removing bad alarms; it is about adding the alarms whose absence lets a real failure go unrecorded.
There is no single public operational-readiness standard. Commissioning is covered generically by ASHRAE Guideline 0 and Standard 202; the data-center-specific ASHRAE Guideline 1.6P was only at first public review draft in October 2026, not final [VERIFIED, draft status, October 2026].
Uptime's Operational Sustainability and M&O Stamp of Approval assess operations, but they are assessments, not a step-by-step readiness checklist an operator can download and follow [VERIFIED, Uptime Institute]. That absence is why a consultant's readiness framework must be labeled as the consultant's own method, not as a standard, and why this case study presents a method, not a certification.
Liquid cooling widens the gap between what is monitored and what can go wrong. ASHRAE Technical Committee 9.9's May 2026 bulletin on technology cooling system coolant integrity warns that direct-to-chip loops can drift invisibly at commissioning and surface as damage months later, coolant composition, entrained air, stainless-steel passivation, and pressure ratings [VERIFIED, ASHRAE TC 9.9 bulletin, May 2026, documented guidance].
The silent compressor case is the chilled-water analogue of the same principle: a cooling variable can drift or dip invisibly for months, and the damage, or in this case the wasted diagnostic effort on the oil system, surfaces later. Trend-watching is the mitigation in both cases, because in both cases the alarm threshold is set for the failure that is already too large to ignore.
One figure deliberately not quoted here: the claim that nearly 70% of early equipment failures trace to design, installation, or startup deficiencies (Donato, 2013) is dated and unverified today [UNVERIFIED, Donato, Emerson/Vertiv ERS, 2013; do not present as a current statistic]. It is omitted from the argument above for that reason. Similarly, no market-size figure for transition-to-operations consulting is quoted, because none was found in public sources that measures this niche specifically [UNVERIFIED, no public source found; not quoted].
7. What a reader can take away
- An alarm system that only notices large failures will never notice small ones. A compressor that stops and restarts within seconds is a real loss of cooling. If your monitoring can only see a sustained excursion past a threshold, that failure does not exist in your records, and a failure that does not exist in your records cannot be trended, triaged, or fixed.
- Trend the controlled variable; do not only watch it. The chilled-water supply temperature was already being recorded. The failure was found by looking at the trend against the plant's own baseline, not by installing anything new. The cheapest monitoring upgrade is a habit, not a purchase.
- Compare against the sister unit. A small change in one compressor is hard to judge alone. The same change, absent in its twin under the same load, is a finding. Sister-unit comparison is the fastest way to separate a real deviation from noise.
- Check calibration before changing a setpoint. A small reported change can be the plant or the sensor. Changing a setpoint on a drifting sensor makes the plant worse while appearing to fix the reading. Change one variable at a time, measure against the baseline, and revert if it does not help.
- Do not believe the first label the plant offers. A low-oil-differential-pressure trip on a shaft-driven oil pump is the expected consequence of a slow compressor restart. Investigate what happened before the trip, not only what the trip says. The visible symptom is not always the cause, and a trip that points at the wrong system closes the investigation in the wrong place.
- Log what the control system does not log. A failure with no alarm, no event log, and no BMS/HMI record has to be logged by hand, or it does not exist for the site's learning. A single observation is dismissible; a log of thirty-five to forty-two events a week is not.
- Apply the same discipline to slow drift as to fast events. The dry cooler fouling over a dusty summer, approach temperature and heat-exchanger temperature difference creeping upward, is caught by the same method as the silent compressor failure: trend, anticipation, and condition-based response. The timescale changes; the habit does not.
- Do not confuse finding a failure with fixing it. This case records a discovery, not a repair and not a measured improvement. Claim only what the evidence supports, and keep the discovery visible until the fix is evidenced too.
8. How the consulting offers map to this case
The mapping below describes what the offers cover for a client in a similar position. The three offers are used by their exact names, and nothing in this section is a promise of a result.
| Offer | What it covers, in this case's terms |
|---|---|
| Operational Efficiency & Procedure Review | The lead offer for this case. Review of the SOP, MOP, and EOP library and operating efficiency: procedure quality checks, drill validation, and setpoint and cooling-efficiency opportunities, including trend review against baselines, sister-unit comparison, alarm rationalization (adding the rate-of-change and deviation alarms this case was missing), setpoint discipline, and procedure-compliance sampling. Advisory only, the consultant recommends operational changes and identifies where a design change would be needed, for the engineer of record to assess. No setpoint is changed by the consultant, and no PUE or saving figure is promised. |
| Transition-to-Operations Readiness | The readiness assessment before the signing moment: people, procedures, asset information, and support arrangements checked before operations takes responsibility. Includes the scored Handover Gate: Sign, Sign with conditions, or Do not sign, applied per area or building. A handover review that asked "which failures can this alarm set not see?" would have surfaced the silent-failure blind spot before turnover instead of after it. |
| Post-Turnover Operational Watch (90-day / 12-month) | The bounded first-year watch: baselining in the first 30 days, weekly trend and alarm review, seasonal-transition support, infant-mortality triage against a failure-mode catalogue, and the month-10 warranty-expiry punch-list. The silent compressor failures are exactly the kind of first-year behavior the weekly trend review exists to catch, a failure mode commissioning could not have shown, surfacing only once the plant is running at real load. |
Scope and limits: read before inquiring
- In scope: data-center operations; transition from construction to operations; operational efficiency. Operability review, handover criteria, and operations-and-maintenance input at the operator's side of handover are in scope.
- Not offered: Tier or M&O certification (only Uptime Institute awards those); engineering design or a PE stamp; commissioning re-performance or witnessing and signing of commissioning test records; 24×7 cover, acting as duty manager, or operating the site; licensed or energized work, or directing energized work; a fixed price for undefined scope, or a fixed timeline before scoping; a zero-outage guarantee, a guaranteed uptime figure, or a guaranteed PUE or saving figure. Construction and build consulting is out of scope except for operability, handover, and operations-and-maintenance input as above.
- "Power In, Heat Out, Nothing Down" is the book's core model, not a consulting promise. It is not presented here as an uptime guarantee, and no statement in this case study should be read as one.
Sources and labeling
Sources consulted for this case study:
- The author's operating account (silent chiller-compressor failures: eight compressors across four chiller plants; compressors running back to zero and restarting within seconds; recovery before the loss-of-cooling alarm setpoint; no alarm, no event log, no BMS/HMI record; large chilled-water volume masking the loss; small changes in chilled-water supply temperature as the only clue; five to six silent failures a day; low-oil-differential-pressure trip on slow restart from shaft-driven oil pumps) and Chapter 7 method (reliability as day-to-day attention to detail, trend, anticipation, and condition-based response; approach-temperature and heat-exchanger temperature-difference trends as a dry cooler fouls over a dusty summer).
- Research report, 1–2 November 2026, industry context, outage data, commissioning levels, provider coverage.
- Uptime Institute, Annual Outage Analysis 2025 (via CoreSite summary) and Annual Outage Analysis 2026, May 2026; Uptime Institute, "Top 14 Considerations for Addressing Data Center Facilities Management Risks", February 2021.
- ASHRAE Technical Committee 9.9, TCS coolant-integrity bulletin, May 2026; ASHRAE Guideline 1.6P, first public review draft, October 2026.
- AI Data Center Guide procedure skeleton (60-second first-stabilizing-action target [Practitioner target, AI Data Center Guide template, not a standard]).
Further reading
- Case Study 1: Transition-to-Operations Readiness, what was missing at handover, and what the Handover Gate would have caught.
- Case Study 2: Post-Turnover Operational Watch, what drifts in the first 12 months, and how a watch catches it earlier.
- Case Study 4: SOP / MOP / EOP Authorship and Drill Validation, how procedures get good enough to trust at 3 a.m.
- Case Study 5: The Cascading Loss of Cooling, what buys time when cooling is lost completely?
- Case Study 6: Building Operator Capability, how operator capability is built in a fast-growing facility.
- First 12 Months After Turnover guide, what goes wrong in the first year, and how to catch it early.
- SOP / MOP / EOP guide, procedures that hold under pressure.
- The Handover Gate, the readiness scorecard for the signing moment.
- Case Studies, all six case studies.
- Trend Over Alarm, why the trend, not the alarm, catches a silent failure.
- Chillers and Heat Rejection: Three Topologies, Not One, how chillers move heat out of the building.
- Services, transition-to-operations help. Tell us about your project and we will scope it together; no engagement starts before a written scope is agreed.