
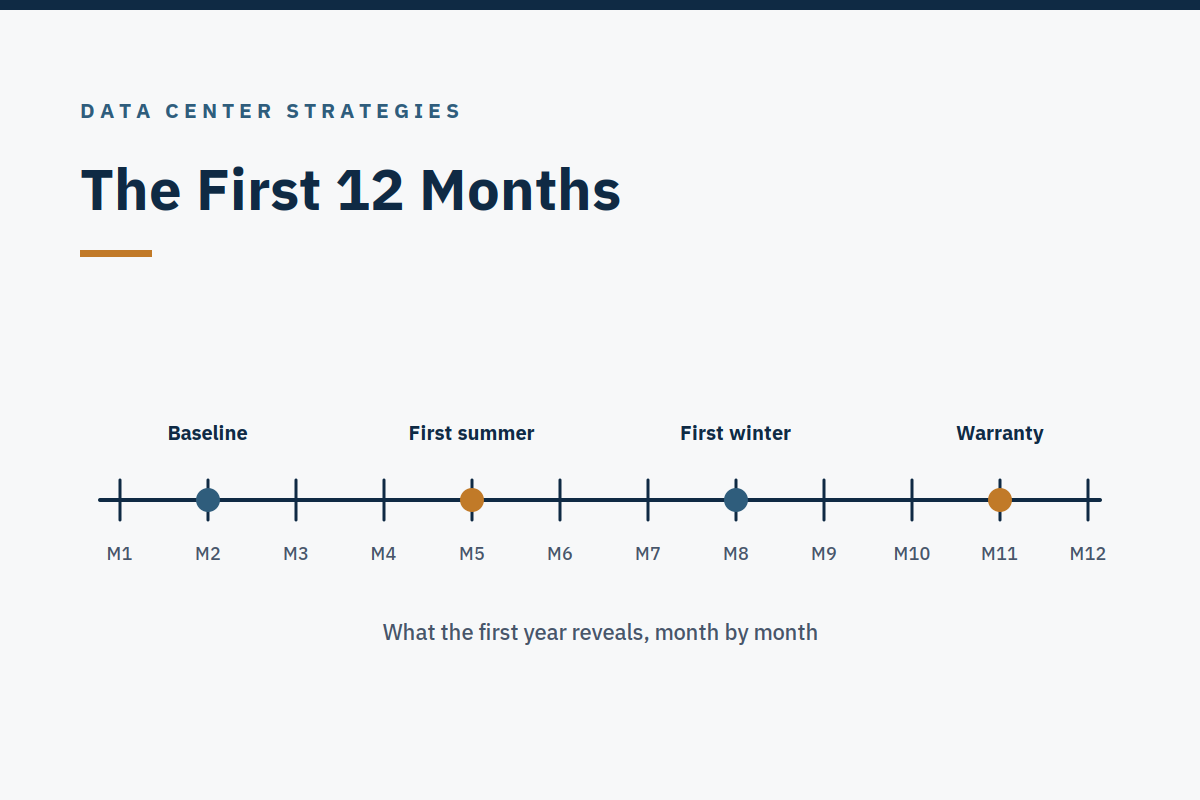
Summary: the short version. The first year after turnover is not a quiet settling-in period. Commissioning continues up to one year post-occupancy, deferred and seasonal testing, optimum-operation adjustment, warranty review, lessons learned (VERIFIED, Data Center Knowledge / Vertiv; GATE Energy L6 definition). Integrated systems testing cannot fully simulate seasonal variation, real IT load profiles, or the control drift that appears once a loop reaches steady-state temperature under heavy load. So the first year brings a predictable pattern, not surprises: early component failures, seasonal cooling transitions, chiller tuning and calibration drift, alarm floods, redundancy erosion, and warranty-boundary disputes.
This guide maps that pattern, twelve failure modes, F1–F12, and the watch that catches each one early: baselining in the first 30 days, a weekly check-in with a redundancy board and a failure log, seasonal-transition checklists, and a month-10 warranty-expiry punch-list.
Why is the first year different from every year after it?
Three things make the first year different, and they all follow from one fact: the building has never been operated before.
First, nothing has been proved under real conditions. Commissioning proved the plant under test conditions, load banks, simulated failures, a compressed schedule. The first year is the first time the plant meets real IT load, real seasons, and real operators, all at once. Control sequences that looked right on paper have never been exercised at real load, at steady-state temperature, under the actual operating profile. Sensors that were calibrated at installation have never drifted. A chiller that staged cleanly in a test has never had to stage against a load that is itself changing.
Second, the warranty clock is running. Every failure in the first year is potentially a warranty claim, a vendor defect, or an installation defect, but only if it is logged, classified, and claimed before the clock runs out. A failure that is fixed quietly, without a claim reference, is a failure the owner paid for twice: once in the construction price, once in the repair.
Third, the team is still learning the building while the building is already in service. The operators are building their mental model of normal, what the plant looks like when it is healthy, what a trend looks like before it becomes an alarm, at the same time as the plant is producing its first failures. That is why the first month is for baselining, not for optimization, and why the watch exists: a second pair of eyes and a keeper of the baseline, while the site's own team operates the plant.
The scale of the problem is worth stating. In Uptime Institute's Global Data Center Survey 2026 (July 2026), 47% of operators reported an impactful outage in the prior three years, down from 50% in 2025, the sixth consecutive year of decline on a per-site basis (VERIFIED, Uptime Institute, Global Data Center Survey 2026, July 2026). Outage frequency is falling, but outage cost is rising: 71% of operators who had an outage said their most damaging outage cost at least $100,000, up from 57% the year before (VERIFIED, same survey).
And in the 2026 Outage Analysis, 57% said their most recent major outage cost more than $100,000, and 1 in 5 said more than $1 million (VERIFIED, Uptime Institute, Annual Outage Analysis 2026, May 2026). Note the two 57% figures have different bases and different survey years, do not present them as the same finding. The first year is where a large share of that cost is decided, because it is where the plant's weaknesses are discovered, by the operator, or by the outage.
The first-year failure-mode catalogue: F1–F12
The twelve failure modes below are the diagnostic core of the first year. Triage every weekly failure against this catalogue. They are expected, not exceptional, the watch exists to catch them early, and the warranty clock exists to make the contractor fix them.
| # | Failure mode | How it shows up | First response (operator-side) |
|---|---|---|---|
| F1 | Infant mortality: component | Early-life failures of a pump, fan, breaker, sensor, or controller in the first months | Follow the EOP for the affected system; log the failure with age/hours, batch/serial, and operating conditions; quarantine the failed part for warranty |
| F2 | Seasonal transition: cooling | First hot season (or first cold snap) exposes a chiller, tower, dry-cooler, or economizer mode never tested at that ambient; capacity shortfall or hunting at the changeover | Pre-season checklist; run the transition as a planned, staffed event, not a background mode change; trend supply/return and approach temperatures through the transition |
| F3 | Chiller tuning / calibration drift | Control sequences do not match design intent; sensors drift; a chiller hunts, short-cycles, or fails to stage; staging logic fights the load | Trend over alarm: compare the controlled variable against its setpoint and against the sister unit; check sensor calibration before changing a setpoint |
| F4 | Cascading loss of cooling | One cooling failure propagates: the remaining plant cannot carry the load, hall temperature rises, servers throttle then shut down; in a cold-plate hall, chip thermal limits can be reached in seconds | Loss-of-cooling EOP immediately, first stabilizing action inside 60 seconds of opening the document (Practitioner target. AI Data Center Guide template, not a standard); shed or transfer load per the EOP if the design provides for it; do not improvise a cooling sequence |
| F5 | Alarm floods | A single fault generates dozens of alarms; the operator cannot find the initiating event; genuine new alarms are missed | Alarm rationalization: one alarm = one required action; see the alarm thresholds below |
| F6 | Warranty-boundary disputes | A failure sits between two vendors (cooling vs. IT vs. installer); each disclaims it; the repair waits while the argument runs | Warranty-responsibility matrix; a common TCS supply temperature/flow/pressure agreement held by the operator; log the dispute with dates, parties, and operational impact |
| F7 | Redundancy erosion | The plant is 2N on paper and N on a Tuesday afternoon: a UPS in maintenance bypass, a bus-tie breaker racked out and never racked back, a CDU loop isolated for a repair and never returned | Redundancy board: the shift team records, every shift, the actual redundancy state of each system; any erosion is briefed at handover and has a return-to-service date |
| F8 | Coolant integrity drift (liquid-cooled sites) | Coolant composition, entrained air, stainless passivation, or pressure drifts invisibly at commissioning and surfaces as damage months later | Coolant sampling and lab verification on the watch schedule; trend conductivity, chemistry, pressure, flow, and filter restriction |
| F9 | Controls / supervisor loss | BMS/EPMS view lost; supervisory-only sequences (chiller staging, load-shed, lead-lag rotation, optimization) lost with it; a shared controller defeats redundancy on both sides at once | Loss-of-view EOP; confirm the designed fail-safe per device (hold-last-position can be unsafe. The correct behavior is a designed fail-safe per device) |
| F10 | Maintenance-induced failure | A planned intervention causes the outage it was meant to prevent: wrong breaker racked, wrong valve closed, a MOP step skipped under time pressure | MOP discipline: hold points, back-out plan, abort authority, two-person rule; no MOP on critical plant at night as a first-time performance |
| F11 | Generator / transfer failure on demand | Generator fails to start, fails under load, or the ATS transfer does not happen as tested; battery recharge adds load on top of IT load after transfer | Loss-of-power EOP; test the transfer as it would actually happen, with the engine carrying load |
| F12 | Fire / leak / water ingress interacting with cooling | A coolant leak is treated as a cooling event only, not as a fire-protection and containment event; aisle containment obstructs sprinklers or gas | Leak EOP plus fire-protection coordination; treat a coolant leak as a fire-protection event (state the fluid type and its flammability) |
Source: Data Center Strategies consulting method, Post-Turnover Operational Watch §2.2 (failure-mode catalogue F1–F12).
A note on infant mortality: what the bathtub curve does and does not say
The bathtub curve is a real model, but it is often quoted as if a single percentage applied to facility plant. It does not. The USENIX study of about 100,000 disks found "rather than a significant infant mortality effect, we see a significant early onset of wear-out" (VERIFIED, USENIX disk study, about 100,000 disks). For facility equipment, the documented early-failure mechanism is more often design, installation, or startup deficiency and control or calibration error than component bathtub mortality.
The credible statement is: new plants see a cluster of early failures from a mix of manufacturing defects, installation errors, and unproven control sequences, which is why burn-in, IST, and a first-year watch matter, not that a single bathtub percentage applies. Do not quote the dated "nearly 70% of early failures traceable to design/installation/startup" figure (Donato, 2013) as a current statistic. It is UNVERIFIED today and is not quoted in this guide.
Baselining: the first 30 days define "normal"
The first month establishes the baseline for every trended variable. Normal is defined by the plant's own data, not by a vendor brochure. Baselines are set per system and per mode, normal, economizer, transfer, maintenance, and re-baselined after any material change (load step, seasonal change, plant modification). A baseline without a stated mode and load is not a baseline.
What to baseline, in practice: PUE and WUE (with their measurement boundaries stated, see the Liquid Cooling Operations guide for why a PUE quoted without its boundary, period, load, and climate is a slogan, not a number); supply and return temperatures and approach temperatures; CDU flow, pressure, and conductivity on a liquid-cooled site; UPS load and battery; generator test results; alarm rate per operator.
Trend over alarm is the discipline: rate-of-change and deviation alarms on trended data, in addition to threshold alarms. A slow drift that never crosses a threshold is still a failure in progress, and in the first year, it usually is one.
The most common baselining mistake is optimizing before baselining. A setpoint change in week two, made because a number "looked high", destroys the baseline and hides the drift it was meant to reveal. The rule for the first 30 days is simple: watch, record, do not tune. Unless safety or the load requires it, in which case the change goes through change control and the baseline is re-set and dated.
Seasonal transitions: the test IST could not run
The first hot season, or the first cold snap, is the test integrated systems testing could not run. IST cannot fully simulate seasonal variation, real IT load profiles, or control drift at steady-state temperature under heavy load (VERIFIED, method statement, documented commissioning practice, Data Center Knowledge / Vertiv). So the seasonal transition is run as a planned, staffed event, not a background mode change, with a checklist run two weeks before the expected changeover and again two weeks after.
Into the hot season: the site's own chiller, tower, or dry-cooler capacity evidence checked against forecast load and ambient (the reviewer checks the evidence; he does not perform the capacity calculation); economizer changeover points checked against the site's sequence-of-operations record; condenser and tower water treatment and blowdown checked; CDU and cooling-loop chemistry sampled; alarm setpoints for high temperature reviewed; load-shed and transfer provisions confirmed; spares for the hot season (fans, pumps, filters) checked.
Into the cold season: freeze protection (glycol concentration where applicable. The site's own mix is per its design and coolant specification); economizer and free-cooling hours expected and changeover confirmed; heating and humidification checked; outdoor equipment (tower basin heaters, louvers, drains) inspected; fuel levels and generator cold-start provisions confirmed.
After each transition: trend review against the baseline; any hunting, short-cycling, or staging fight logged as a tuning action; lessons recorded for the next year's transition. The second year is easier than the first for exactly one reason: the plant has now seen both seasonal extremes, and the modes that were never exercised are no longer assumed to work. They are listed as residual risks, or they have been exercised and proved.
Alarm floods, redundancy erosion, and the weekly check-in
Alarm discipline: the numbers that tell you the system is broken
Acceptable steady state is below 1 alarm per 10 minutes per operator; a flood is more than 10 alarms in 10 minutes. Every alarm must require a specific operator action within a defined time, one alarm = one required action (VERIFIED, ISA-18.2 and EEMUA 191 / IEC 62682, via published summaries, paywalled standards, no clause number asserted). A single fault that generates dozens of alarms is not a monitoring success. It is an alarm system that has failed, and the operator cannot find the initiating event while genuine new alarms are being missed.
The weekly alarm review covers: alarm count per operator, any flood, bad actors (alarms that fire repeatedly without requiring action), and shelved or suppressed alarms with their expiry dates. Shelving without an expiry is not shelving. It is deletion.
The redundancy board: what the plant actually is, every shift
The plant is 2N on paper and N on a Tuesday afternoon. That is not a joke; it is the most common first-year failure mode in the catalogue (F7). A UPS in maintenance bypass, a bus-tie breaker racked out and never racked back, a CDU loop isolated for a repair and never returned, each one quietly removes the redundancy the design assumed. The countermeasure is a redundancy board: the shift team records, every shift, the actual redundancy state of each system (N, N+1, 2N, or degraded), any erosion is briefed at handover, and every erosion has a return-to-service date.
The concurrent-maintenance demonstration at IST, removing a component or path for planned maintenance without affecting IT, is the Tier III/IV proof that this board is measuring something real. Return-to-service verification after every MOP is what keeps the board honest.
The weekly check-in agenda
A first-year watch runs a weekly check-in, remote or on site per agreement, with a fixed agenda and a one-page note filed with the shift log, not emailed and forgotten.
The agenda: (1) redundancy board; (2) failure log, new failures since last week, by system, with age/hours and warranty status, any repeat failure flagged; (3) trend review, the week's trends against baselines; (4) alarm review; (5) work performed and planned, MOPs completed with return-to-service verification, MOPs planned, any setpoint or sequence change with its change-control record; (6) Gate conditions, progress on any "sign with conditions" items from the Handover Gate, and any new condition; (7) risks for next week, seasonal change, load change, vendor visit, maintenance window, staffing gap.
After day 90, the check-in goes monthly, plus seasonal-transition checklists and the month-10 warranty review.
Worked examples: three cases from the first year
The pattern, not the surprise. Case Study 2: Post-Turnover Operational Watch is a case study that walks the full first year: infant mortality, seasonal transition, and tuning drift as a pattern, with drift charts and a seasonal timeline that are ILLUSTRATIVE shapes, not site data. The recorded facts in the author's account are the ones that matter for this guide: a ~200,000-gallon loop that bought "a minute or two", thousands of servers at risk, and chillers restored over several hours. Read it for the shape of a year that was watched, not survived.
The failure that raised no alarm. Case Study 3: The Silent Compressor Failures is the purest example of trend-over-alarm in this series. Eight compressors across four chiller plants were failing silently, running back to zero and restarting within seconds, five to six times a day, with zero alarms, no event log, and no BMS/HMI record. The only clue was small changes in chilled-water supply temperature.
The recorded rate (5–6 per day, as recorded in the author's account) is the fact; the day-by-day split and temperature values in the graphs are ILLUSTRATIVE, and the weekly total of 35–42 is an ESTIMATE (5–6 per day × 7). The lesson is the discipline this guide keeps repeating: watch the trend, not the alarm. A first-year watch that only reviews alarms would have missed this entirely, for months.
The cascade. Case Study 5: The Cascading Loss of Cooling records a cascading loss of cooling that developed over several hours at a newly constructed, liquid-cooled AI facility: a spring-to-summer transition at the hottest period of the day, cascading chiller failures to complete loss of cooling, thousands of servers at risk, a single facility water pump that kept running, recirculation plus a ~200,000-gallon loop that bought a minute or two, and one chiller then a second restored over several hours. The graphs are qualitative schematics with no percentage values and no clock times.
The account records neither the number and order of chiller failures nor clock times. The lesson is thermal mass: it is a buffer measured in minutes at full load, not a ride-through. The mitigation is UPS-backed TCS pumps and CDU controls and a drilled loss-of-cooling EOP with a first stabilizing action inside 60 seconds of opening the document (Practitioner target. AI Data Center Guide template, not a standard). See the Liquid Cooling Operations guide for the full treatment of what changes for the operator on a liquid-cooled site.
Incident learning, not incident blame
After any incident or near-miss: (1) stabilize and restore, using the EOP; (2) preserve the record, BMS/EPMS trends, sequence-of-events, alarm log, shift log, the MOP in use; (3) within 7 days, a structured review, what happened, what the procedure said, what the operator did, where they diverged and why, what the plant did, what the indications showed; (4) owned actions with dates, procedure change, drill, training, plant fix, or vendor follow-up; (5) the EOP or MOP is re-issued and re-drilled if it was changed.
The review asks "what in the procedure, the training, or the plant made this the likely outcome?", not "who is to blame?" That question is not kindness. It is accuracy: blame stops the next person from reporting the next near-miss, and the near-miss is the cheapest lesson the plant will ever offer.
The month-10 warranty-expiry punch-list
The warranty review is issued at month 10, not month 11. By month 11 it is too late to do anything about what it finds. The punch-list has seven parts:
- Failure-log review. Every failure in months 0–10, classified: warranty claim, vendor defect, installation defect, operations, or wear. Every warranty-classified failure has a claim reference, or a written reason it was not claimed.
- Issue-log sweep. Every open item, with its warranty status. Nothing warranty-covered is left to expire unclaimed.
- Seasonal evidence. The plant has now seen, or is scheduled to see, both seasonal extremes. Any mode never exercised is listed as a residual risk, not assumed to work.
- Coolant evidence (liquid sites). Lab results across the 10 months, passivation records, pressure and hydrostatic evidence, leak-detection test records.
- Controls evidence. Alarm rationalization results, setpoint-change log, supervisor-loss and failure-domain re-tests after any change.
- Punch-list. Each item: description, evidence, owner (contractor or vendor), due date before warranty expiry, and the consequence if it slips past expiry.
- Close-out. A lessons-learned workshop and a close-out report recording what the first year taught, what changed in the procedures, and what the next site should do differently.
The most expensive sentence in the first year is "we'll claim that later." Later is month 13, and the warranty expired in month 12.
When to ask for help: Post-Turnover Operational Watch
The watch is the second of Data Center Strategies' three offers: Post-Turnover Operational Watch: 90-day / 12-month. It is a bounded first-year operator watch after turnover: baselining, trend review, control-sequence tuning advice, seasonal-transition support, and a warranty-expiry punch-list. The consultant is the operator's second pair of eyes and the keeper of the baseline; the site's own team operates the plant. It is not 24×7 cover and not acting as duty manager. The watch starts after turnover, not before it, if turnover slips, the watch start slips with it.
Indicative scope anchors (not a price for any specific site; priced only after scoping): 90-Day Watch $6,500 per month (3 months); 12-Month Watch $5,500 per month; 12-Month Watch. Enhanced $6,500 per month (plus structured 10-month warranty review and lessons-learned workshop). The retainer covers remote advisory work only; site visits are not included, billed at a site-visit day rate of $2,400 per day plus expenses at cost. Monthly in advance. A watch that becomes open-ended 24×7 cover is out of scope. These are anchors from the consulting playbook; they are not a quotation.
What the watch does not do, stated plainly: it does not award or guarantee Tier or M&O certification; it does not provide engineering design or a PE stamp; it does not re-perform commissioning; it does not operate the site or provide 24×7 cover; it does not perform or direct licensed or energized work; and it promises no zero-outage guarantee, guaranteed uptime figure, or guaranteed PUE or saving figure. Availability figures are statistical expectations from topology, not guarantees.
Tier III's 99.982% (about 1.6 hours of downtime per year) and Tier IV's 99.995% (about 0.44 hours, or 26 minutes, per year) are reference values derived from topology, not contractual uptime guarantees (VERIFIED, Uptime Institute Tier Standard: Topology).
To start a conversation about a watch, see the contact page. Tell us about your project and we will scope it together; no engagement starts before a written scope is agreed.
Questions operators ask about the first year
We signed with conditions. When do they stop being conditions? When the evidence exists, the document read, the test record checked, the drill observed, and the condition is closed in the issue log with an owner and a date. A condition that is "mostly done" is still a condition. The weekly check-in tracks Gate conditions until they close.
Our first year has been quiet. Does that mean the plant is good? Not necessarily. A quiet first year can mean a good plant, or it can mean a silent failure like Case Study 3, five to six compressor failures a day with no alarm. The test is not the alarm count. It is the trend review: are the trended variables behaving the way the baseline says they should?
Should we change setpoints in the first year? Only through change control, with a return-to-service check, and with the baseline re-set and dated. Chiller tuning is a first-year operations task, control sequences that were never exercised at real load will need tuning, but tuning without a baseline is guessing, and guessing under load is how a tuning problem becomes an outage.
What if turnover slips? The watch start slips with it. A watch that starts before turnover is a readiness review wearing the wrong name, and it will be asked to do readiness work without readiness authority. The engagement states how a slip is handled; agree it in advance.
How does this guide relate to the Handover Gate? The Transition to Operations guide is the prequel: the gate, the 27 checks, the eight red lines, and the three verdicts. This guide is what happens after the verdict, the year the gate was protecting. Read them in that order.
Further reading
Further reading: The First 12 Months: Infant Mortality, Seasonal Change, and the Warranty Clock, Trend Over Alarm: The Operator's Problem Is Too Much Information, Not Too Little, and Alarm Discipline: One Alarm, One Action, Within a Defined Time.
Sources
Sources for the figures cited in this guide.
- Uptime Institute, Global Data Center Survey 2026 (Keynote Report 209), July 2026, 47% of operators reported an impactful outage in the prior three years, down from 50% in 2025, the sixth consecutive year of decline on a per-site basis; 71% of operators who had an outage said their most damaging outage cost at least $100,000, up from 57% the year before. VERIFIED. Base for the 71%: operators who had an outage, not all operators.
- Uptime Institute, Annual Outage Analysis 2026 (Keynote Report 201), May 2026, 57% said their most recent major outage cost more than $100,000, and 1 in 5 said more than $1 million (2025-survey respondents; different base and survey year from the survey figures above. Do not present the two 57% figures as the same finding). VERIFIED.
- Uptime Institute, Annual Outage Analysis 2026, May 2026, Fig. 14, failure to follow established procedures the leading driver of human-error outages at 59% (n=199). VERIFIED.
- Data Center Knowledge / Vertiv; GATE Energy (L6 definition), commissioning continues up to one year post-occupancy; L6 is post-occupancy / seasonal testing; IST cannot fully simulate seasonal variation, real IT load profiles, or control drift at steady-state temperature under heavy load. VERIFIED, method statement.
- ISA-18.2 and EEMUA 191 / IEC 62682, via published summaries, acceptable steady state below 1 alarm per 10 minutes per operator; a flood is more than 10 alarms in 10 minutes; one alarm = one required action. VERIFIED. Paywalled standards, cite via published summaries, do not invent clause numbers.
- USENIX disk study (about 100,000 disks), "rather than a significant infant mortality effect, we see a significant early onset of wear-out". VERIFIED. The Donato 2013 "nearly 70%" figure is UNVERIFIED today and is not quoted in this guide.
- Uptime Institute Tier Standard: Topology. Tier III (concurrently maintainable) reference availability 99.982%, about 1.6 hours of downtime per year; Tier IV (fault tolerant) 99.995%, about 0.44 hours (26 minutes) per year. VERIFIED. Reference values, not guarantees.
- Data Center Strategies consulting method. Post-Turnover Operational Watch §2.2, failure-mode catalogue F1–F12, baselining, seasonal-transition checklists, month-10 warranty punch-list (consultant's own method).
- Case Study 2: Post-Turnover Operational Watch; Case Study 3: The Silent Compressor Failures; Case Study 5: The Cascading Loss of Cooling (case studies, November 7, 2026). Drift charts, seasonal timelines, day-by-day splits, and temperature values are ILLUSTRATIVE unless a caption states a recorded rate.
- Uptime Institute's own caution, Annual Outage Analysis 2025: "Data relating to outages should be treated skeptically. All methodologies… are subject to uncertainty, partly because of a lack of transparency and reliable reporting mechanisms." VERIFIED, method note.
Takeaway. The first year is a pattern, not a surprise: early failures, seasonal transitions, tuning drift, alarm floods, redundancy erosion, and warranty disputes. F1 through F12. The watch that catches them is unglamorous and specific: baseline in the first 30 days, a weekly check-in with a redundancy board and a failure log, seasonal transitions run as staffed events, and a warranty punch-list at month 10, not month 11. Log every failure with age, batch, and conditions, because the failure log is the warranty evidence, and the warranty clock does not wait.
Next: read SOP / MOP / EOP. Procedures That Hold Under Pressure for the procedures the first year will test, and Liquid Cooling Operations if your hall is liquid-cooled, because the first year on a liquid-cooled site has failure modes air-cooled sites never see.