
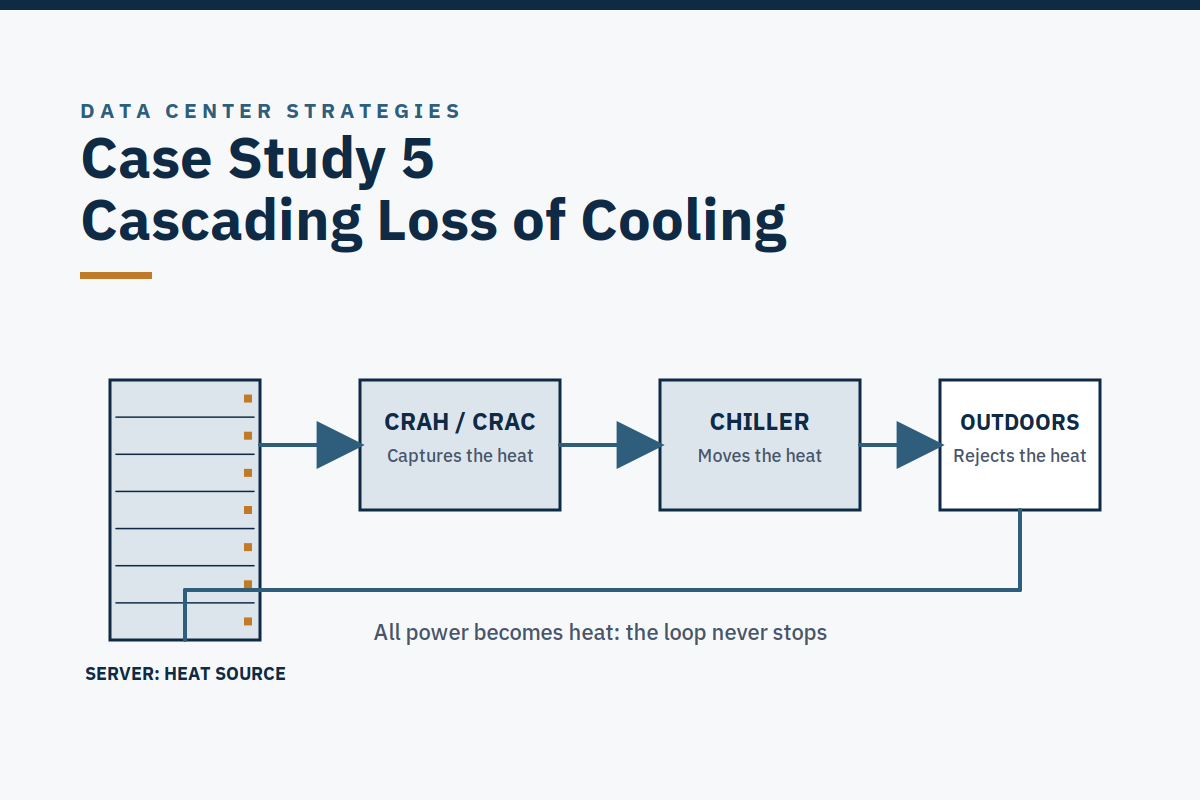
Drawn from the author's operating experience. Client details are anonymized.
| Case | 5. Incident response and recovery: the cascading loss of cooling |
| Series | Data Center Strategies: Case Studies |
| Author | Scott Stillings, Data Center Strategies |
| Date | 7 November 2026 |
| Sources | The author's own account of the incident; Data Center Strategies consulting method; industry context in the Data Center Strategies research report, 1–2 November 2026 |
What this case is, and what it is not
This is a case study drawn from Scott's own lived operating experience. A newly constructed, liquid-cooled AI facility, a spring-to-summer changeover, and a closed loop of approximately 150,000–250,000 gallons [Author's account: roughly 200,000 gallons; the range is shown because the account gives an approximate figure, not a measured volume] describe a common facility pattern, not an identifiable site.
The case is also not a promise. "Power In, Heat Out, Nothing Down" is the book's core model, not a consulting guarantee, and nothing here guarantees an uptime figure, a PUE figure, or a zero-outage outcome.
The consultancy does not award or guarantee Tier or M&O certification, does not provide engineering design or a PE stamp, does not re-perform commissioning, does not provide 24×7 cover or act as duty manager, and does not direct licensed or energized work. Its scope is operations, transition to operations, and operational efficiency, not construction or build consulting, except operability review, handover criteria, and O&M input at the operator's side of handover.
1. Situation
A newly constructed, liquid-cooled AI facility was in its first year of operation, the first 12 months [Author's account], the window in which a new plant's early failures, seasonal transitions, and tuning problems all arrive together. The team had been hired in advance of turnover, the SOP and EOP library had been prepared, shift-operations expectations had been set, and responsibility had transferred at the signing moment to a team that had never owned or operated a data center before.
The incident arrived at the worst intersection the first year offers: a spring-to-summer seasonal transition, at the hottest period of the day [Author's account]. The cooling plant was changing posture from free-cooling (dry cooler) to chiller operation, the seasonal changeover in which a mode that has never been exercised at that ambient, at real load, is exercised for the first time. The facility was carrying its AI load, and thousands of servers were at risk [Author's account].
Three first-year conditions were already in play before the cascade began, and each matters to understanding it:
- Seasonal transition. The changeover from free-cooling to chiller posture had not yet been proven at summer ambient and real load.
- Chiller tuning and calibration struggles. Control sequences that had passed commissioning had not been exercised at real load, at steady-state temperature, under the actual operating profile, the classic first-year tuning problem.
- Equipment infant mortality. The first 12 months [Author's account] had already brought a cluster of early equipment failures.
None of these three is presented here as the cause of the cascade. The author's account records the sequence, not a root-cause finding, and this case does not invent one.
2. What was found
The chillers began to fail one after another, a cascading loss of cooling that ended in complete loss of cooling [Author's account]. In the consulting method's failure-mode catalogue this is F4, cascading loss of cooling, the catalogue's definition, not this incident's outcome: one cooling failure propagates because the remaining plant cannot carry the load, hall temperature rises, and servers throttle and then shut down.
The account records no server throttling or shutdown figure for this incident, so none is stated here. In a cold-plate hall, chip thermal limits can be reached in seconds once flow or cooling is lost, which is why a loss-of-cooling event is measured in seconds and minutes at the start, not hours.
What the team found, in the terms of the account, was this: the chiller plant was going away faster than it could be brought back, the load was not going away at all, and the only cooling asset still available was the water already in the loop and the pump still moving it.
Two things the account does not record, and this case therefore does not state: the number of chillers that failed, and the order or cause of the individual chiller failures. "Cascading" describes the pattern, each failure leaving the survivors carrying more than they could hold, not a counted sequence. No temperature reading, no elapsed-time figure, and no count of servers affected is given in the account, so none is given here.
3. What was done
Method numbers in this section, the 27 Gate checks, the score bands, the 7-day review window, the Top-10 list, are the consultant's own method, not verified facts.
3.1 The method the response is judged against
The consulting method for a loss-of-cooling event (F4) is short, because the event is short:
- Open the loss-of-cooling EOP immediately. The first stabilizing action should fall inside 60 seconds of opening the document, [Practitioner target, AI Data Center Guide template, not a standard].
- Stabilize first, diagnose second. Shed or transfer load per the EOP if the design provides for it. Do not improvise a cooling sequence.
- Preserve the record. BMS/EPMS trends, sequence of events, alarm log, shift log, and the procedure in use, while the event is still running.
- Afterwards, learn, don't blame. Within 7 days, a structured review: what happened, what the procedure said, what the operator did, where they diverged and why, what the plant did, what the indications showed. The review asks what in the procedure, the training, or the plant made this the likely outcome, not who is to blame. Owned actions follow, with dates: procedure change, drill, training, plant fix, or vendor follow-up. An EOP that was changed is re-issued and re-drilled.
The account is judged against that method below. Where the account is silent, for example, on whether load was shed or transferred, or whether a written loss-of-cooling EOP existed at the time, this case says so rather than filling the gap.
3.2 Minute-by-minute, as given
No clock times are given in the author's account, so no clock times are shown. The sequence below is the account's own order, in phases. The only durations the account gives are "a minute or two" and "over several hours" [Author's account], and they are the only durations used.
Phase 1: Changeover, hottest part of the day. The plant is in spring-to-summer transition, moving from free-cooling (dry cooler) to chiller posture, at the hottest period of the day [Author's account].
Phase 2: The cascade. Chillers fail in succession until cooling is completely lost [Author's account].
Phase 3: The minute or two that mattered. The team kept a single facility water pump running [Author's account]. With no chiller producing cold water, the pump did not restore cooling, it recirculated the water already in the loop. That recirculation, plus the residual heat capacity of the approximately 150,000–250,000-gallon loop [Author's account], bought the team a minute or two [Author's account].
That is the whole of the buffer, and the number is the point of the case: a volume that sounds like hours of ride-through is, at full AI load, a minute or two of grace. The pump was the first stabilizing action [Inference, the account records that the team kept a single pump running; that it was the first and only stabilizing action available is the method's reading of that recorded fact, not a separate recorded fact].
Phase 4: Restoration, one chiller at a time. The team restored one chiller, then a second, over several hours [Author's account]. Cooling was rebuilt chiller by chiller, not switched back on: each restoration returned part of the capacity, and only the second restoration brought the plant back toward meeting the load. The account does not record what fixed the chillers, how long each restoration took, or what the team did between restorations, and this case does not invent those steps.
3.3 What bought time, and what did not
Three distinctions carry the lesson:
- What bought time was the pump plus the water already in the loop, recirculation and residual heat capacity, for a minute or two [Author's account]. It bought time to work the restoration, not time to wait the event out.
- What did not buy time was the volume of the loop on its own. Still water in a 150,000–250,000-gallon loop absorbs heat only until it is warm; without a chiller removing heat, the loop is a countdown, not a reservoir. Thermal mass is a buffer measured in minutes at full load, not a ride-through.
- What restored service was the chillers, one then two, over several hours [Author's account]. Nothing else in the account restored cooling, and the case claims nothing else did.
4. Outcome as recorded in the author's account
The outcome, as recorded, is qualitative: the team held the plant on a single running pump and recirculation through the complete loss of cooling, and restored one chiller and then a second over several hours [Author's account]. Thousands of servers were at risk throughout [Author's account].
What is not recorded, and therefore not claimed, is as important as what is:
- No downtime figure, outage duration, or service-impact figure is given.
- No temperature reading (hall, supply, return, or chip) is given.
- No count of servers throttled, shut down, or damaged is given.
- No PUE, cost, or percentage-improvement figure is given.
- No root cause for the chiller failures is given.
Any version of this case that supplied those numbers would be inventing them. The honest outcome statement is that the team kept the facility alive on its last pump and rebuilt cooling chiller by chiller over several hours, and that the margin between those two facts was a minute or two of warm water.
5. What changed afterwards
The author's account, as given for this case, does not record the specific post-incident procedure revisions that followed. This section therefore does not present any as fact. What follows is the follow-through the consulting method prescribes for an incident of this kind, stated as method, not as a record of what this site did. A reader applying this case should treat each item as a check against their own site's record, not as history.
- Incident review within 7 days, on the preserved record. BMS/EPMS trends, sequence of events, alarm log, shift log, and the procedure in use, asking what in the procedure, the training, or the plant made the cascade the likely outcome. Owned actions with dates, not observations without owners.
- The loss-of-cooling EOP re-issued and re-drilled if it was changed, and drilled as an injected-fault drill, not a tabletop: the fault is actually injected under controlled conditions so the BMS alarms are authentic. A tabletop walk-through is not a drill, and the distinction is recorded.
- The seasonal-transition plan treated as a first-class procedure. The changeover from free-cooling (dry cooler) to chiller posture becomes a planned, staffed event with pre-season checks, capacity evidence checked against forecast load and ambient, changeover points checked against the sequence-of-operations record, alarm setpoints for high temperature reviewed, and load-shed or transfer provisions confirmed, run two weeks before the expected changeover and reviewed two weeks after. In the Handover Gate, this is check 27: a seasonal-transition plan must exist for the first seasonal change the site will face.
- Chiller tuning treated as a first-year operations task, not a commissioning argument. Trend the controlled variables against their setpoints and against the sister unit; check sensor calibration before changing any setpoint; route every setpoint change through change control. Tuning that only appears at real load, at steady-state temperature, is expected. The failure is in having no process for it, not in the tuning itself.
- Infant-mortality triage, not surprise. Every failure in the first 12 months logged with age and hours, batch and serial, and operating conditions, and each classified by cause, because a manufacturing defect, an installation error, and an unproven control sequence have different owners and different fixes. The failure log doubles as warranty evidence, and the warranty clock is what makes that urgent: the month-10 warranty review must find every warranty-classified failure with a claim reference or a written reason it was not claimed.
- The buffer honestly sized. The mitigation for the next loss of cooling is not a bigger loop. It is UPS-backed TCS pumps and CDU controls and a drilled loss-of-cooling EOP with a first stabilizing action inside 60 seconds of opening the document [Practitioner target, AI Data Center Guide template, not a standard]. Any future claim that thermal mass provides a stated ride-through must state the duration and the load it applies to, a ride-through figure without a load is not a figure.
6. Research and industry context
This section is context from published sources, not from the incident. Every figure is labeled with its source and date.
Cooling failures are a minority of outages but they cascade. Cooling accounts for ~13% of most recent impactful outages [VERIFIED: ComputerWeekly reporting Uptime Institute Annual Outage Analysis 2025], against power at 45% in 2025 [VERIFIED: Uptime Institute, Global Data Center Survey 2026, July 2026, Fig. 14; base: respondents who had an outage in the prior 3 years; 56% in 2026], a different base from the 54% of respondents citing power as the cause of their most recent impactful outage [VERIFIED: ComputerWeekly, same analysis], so the two power figures must not be presented as interchangeable.
The reason a 13% cause deserves a case study of its own is the mechanism: loss of cooling leads to overheating, server shutdown, and service failure, and a single cooling failure can propagate across the plant.
The human and procedure share is rising, and it is the largest preventable cause. In Uptime's 2026 analysis, failure to follow established procedures was the leading driver of human-error outages at 59% (n=199) [VERIFIED, Uptime Institute Annual Outage Analysis 2026, May 2026].
For Category 3–5 outages, 87% of operators believe better management and processes would have prevented their most recent incident, on the Uptime survey's own base. Uptime itself cautions that outage data should be treated skeptically, because reporting is incomplete and methodologies are subject to uncertainty [VERIFIED, Uptime Institute Annual Outage Analysis 2025].
The cost of getting it wrong is material. 57% of most recent significant, serious, or severe outages cost more than $100,000, and 1 in 5 cost more than $1 million [VERIFIED, Uptime Annual Outage Analysis 2026, May 2026; base: respondents’ most recent major outage, 2025 survey].
The first year is where commissioning's blind spots appear. Commissioning continues up to one year post-occupancy: deferred and seasonal testing that could not be completed during construction, adjustment for optimum operation, a warranty review before the construction warranty expires, and a lessons-learned workshop [VERIFIED, Data Center Knowledge / Vertiv commissioning guidance, via the transition-to-operations research report, November 2026]. Integrated Systems Testing (L5) cannot fully simulate seasonal variation, real IT load profiles, or the control drift that appears once a loop reaches steady-state temperature under heavy load.
ASHRAE TC 9.9's May 2026 bulletin on technology-cooling-system coolant integrity warns that direct-to-chip loop problems can appear weeks after startup, once the loop reaches steady-state temperature under heavy load [VERIFIED, ASHRAE TC 9.9 bulletin, May 2026, via StorageReview summary]. Level 5 is also the level most at risk from schedule pressure, because it needs the whole plant, full load banks, and an uninterrupted block of time [VERIFIED, Prismecs commissioning guidance, via the research report].
There is no single public operational-readiness standard to fall back on. Commissioning is covered generically by ASHRAE Guideline 0 / Standard 202; the data-center-specific ASHRAE Guideline 1.6P was only at first public review draft in October 2026 [VERIFIED, research report, November 2026]. Uptime's Tier Standard: Operational Sustainability and M&O Stamp of Approval assess operations, but they are assessments, not a step-by-step readiness checklist. That absence is the market opening for an operator's readiness check, and it is why the frameworks in this case are labeled as the consultant's own method, not a standard.
Two figures this case deliberately does not quote as fact. One cited case in the consulting method reports throttling in as little as 23 seconds after a CDU pump failure [VERIFIED for the seconds-scale claim; the 23-second figure is a single cited case, not a general rule].
And the dated claim that nearly 70% of early equipment failures trace to design, installation, or startup deficiencies (Donato, 2013) is UNVERIFIED today and is not presented here as a current statistic. The credible statement, and the one this case uses, is that new plants see a cluster of early failures from a mix of manufacturing defects, installation errors, and unproven control sequences, which is why burn-in, IST, and a first-year watch matter, not that a single percentage applies.
7. What a reader can take away, and how the consulting offer maps to it
Takeaways.
- A cascade is a sequence, not a single failure. The question after the first chiller fails is not "what broke?" but "what does the plant look like with one fewer chiller, at this load, at this ambient?", and then the same question again after the second. Plan for the second failure while you are still responding to the first.
- Thermal mass is minutes, not hours. A 150,000–250,000-gallon loop sounds like a reservoir and behaves like a countdown at full load. If your ride-through claim does not state a duration and a load, it is not a claim.
- The stabilizing action is decided before the incident. Keeping one pump running was the action the account records. The method's lesson is that which pump to keep running, and what it will do, should be an EOP decision made in advance, not improvisation, and the method forbids improvising a cooling sequence during the event.
- Seasonal changeover is a planned event, not a background mode change. The first hot season exposes the chiller, tower, dry-cooler, or economizer mode that was never tested at that ambient. Run it staffed, with a checklist, two weeks before and two weeks after.
- The first year is a triage problem, not a surprise. Infant mortality, tuning drift, and seasonal transitions are expected in months 0–12. The operator's job is to keep a failure log that supports warranty claims before the clock runs out, with every failure classified by cause, not to be surprised by them.
How the consulting offer maps. Each engagement maps to one of the three offers, no fourth offer is invented.
- Transition-to-Operations Readiness, the Handover Gate, applied before the signing moment. This case is the argument for two of its 27 checks in particular: check 7's incident-command roles and check 10's Top-10/15/20 EOP library, which must include a controlled, field-validated EOP for loss of cooling (red line 7: no controlled EOP for a predicted failure mode the site's own design makes credible is a "Do not sign"
- item); and check 27, the seasonal-transition plan for the first seasonal change the site will face. A site that has never drilled its loss-of-cooling EOP as an injected fault has not proven it.
- Post-Turnover Operational Watch (90-day / 12-month), the bounded first-year watch this incident belongs to: weekly trend and alarm review, failure-log triage against the first-12-months catalogue (F1 infant mortality, F2 seasonal transition, F3 chiller tuning, F4 cascading loss of cooling), seasonal-transition checklists, and the month-10 warranty-expiry punch-list. The watch observes, advises, and drills; it does not operate the site and is not 24×7 cover.
- Operational Efficiency & Procedure Review, the procedure work after the event: the SOP / MOP / EOP library reviewed against the quality checks (trigger stated, expected indication after every state change, hold points before irreversible actions, back-out plan, abort authority named), the loss-of-cooling EOP re-issued and re-drilled if changed, and setpoint and tuning changes routed through change control. Advisory only: the consultant recommends operational changes and never changes a setpoint, sequence, or staging logic, and never promises a PUE or saving figure.
Scope and limits
This case study is not an engineering report. It contains no design, no PE-stamped calculation, no commissioning re-performance, and no certification claim. Figures are as recorded in the author's account. The incident's root cause is not established in the account and is not asserted here.
Any reader applying the lessons should verify them against their own plant, their own procedures, and their own engineer of record, and should treat the 60-second first-action target as [Practitioner target, AI Data Center Guide template, not a standard], and the 7-day review window and the Handover Gate checks as [Consultant's own method], not as a standard.
Sources
- Author's account (Scott Stillings), the incident sequence, the single running pump, the approximately 150,000–250,000-gallon loop, the minute-or-two buffer, the restoration of one chiller then a second over several hours, the spring-to-summer transition at the hottest period of the day, thousands of servers at risk, and the first-12-months context of infant mortality, seasonal transitions, and chiller tuning/calibration.
- Data Center Strategies consulting method, failure-mode catalogue F1–F4, Case A (the closed loop that bought minutes, not hours), the incident-response and incident-learning method, the Handover Gate and its 27 checks, and the three offers.
- Data Center Transition-to-Operations Consulting: Research Report, 1–2 November 2026: Uptime Institute Annual Outage Analysis 2025 and 2026 figures, ASHRAE TC 9.9 May 2026 bulletin, ASHRAE Guideline 1.6P public-review status, commissioning levels L1–L6 and first-year post-occupancy practice.
Numbers register: every number in this case, with its label
| Number | Label | Source |
|---|---|---|
| approximately 150,000–250,000-gallon loop | [Author's account] | Author's account |
| A minute or two (thermal buffer) | [Author's account] | Author's account |
| Thousands of servers at risk | [Author's account] | Author's account |
| One chiller, then a second, restored over several hours | [Author's account] | Author's account |
| First 12 months (infant-mortality window) | [Author's account] | Author's account |
| Single facility water pump kept running | [Author's account] | Author's account (count: one) |
| Spring-to-summer transition, hottest period of day | [Author's account] | Author's account (no clock time given) |
| 92% of respondents said human error was at least a minor contributor to their most recent impactful outage | VERIFIED | Uptime Annual Outage Analysis 2026, May 2026 |
| Failure-to-follow share rose 10 percentage points in a year | VERIFIED | Uptime Annual Outage Analysis 2025, via CoreSite summary |
| 59% (n=199), failure to follow procedures as leading driver of human-error outages | VERIFIED | Uptime Annual Outage Analysis 2026, May 2026 |
| 87% for Category 3–5 outages (different base) | VERIFIED | Uptime 2025 survey PDF |
| ~13% of most recent impactful outages caused by cooling | VERIFIED | ComputerWeekly reporting Uptime 2025 |
| 45% of respondents who had an outage in the prior 3 years, power as primary cause of most damaging incident, 2025 (56% in 2026) | VERIFIED | Uptime Institute, Global Data Center Survey 2026, July 2026, Fig. 14 |
| 54% of respondents citing power as cause of most recent impactful outage | VERIFIED | ComputerWeekly reporting Uptime 2025 (different base: not interchangeable with the 45% and 56% figures) |
| 57% of significant/serious/severe outages cost >$100,000; 1 in 5 >$1 million | VERIFIED | Uptime Annual Outage Analysis 2026, May 2026 (2025-survey basis) |
| 60 seconds, first stabilizing action after opening the EOP | [Practitioner target, AI Data Center Guide template, not a standard] | AI Data Center Guide template, via consulting method |
| 7 days, structured incident review | [Consultant's own method] | Consulting method |
| 27 checks, Handover Gate (checks 7, 10, 27 cited) | [Consultant's own method] | Consulting method |
| 23 seconds, CDU pump failure to throttling | VERIFIED for the seconds-scale claim; the 23-second figure is a single cited case, not a general rule | Single cited case in the consulting method; not this incident |
| Nearly 70% of early failures traceable to design/installation/startup (Donato, 2013) | UNVERIFIED | Dated 2013 claim; not quoted as a current statistic |
| No ESTIMATE figures are used in this case | None | None |
Further reading
- Case Study 1: Transition-to-Operations Readiness, what was missing at handover, and what the Handover Gate would have caught.
- Case Study 2: Post-Turnover Operational Watch, what drifts in the first 12 months, and how a watch catches it earlier.
- Case Study 3: The Silent Compressor Failures, how do you find a failure that raises no alarm?
- Case Study 4: SOP / MOP / EOP Authorship and Drill Validation, how procedures get good enough to trust at 3 a.m.
- Case Study 6: Building Operator Capability, how operator capability is built in a fast-growing facility.
- Liquid Cooling Operations guide, what changes for the operator when cooling is liquid.
- First 12 Months After Turnover guide, what goes wrong in the first year, and how to catch it early.
- The Handover Gate, the readiness scorecard for the signing moment.
- Case Studies, all six case studies.
- Loss of Cooling, why liquid-cooled halls fail in seconds and air-cooled halls fail in minutes.
- Incident Response: The First 30 Minutes, the first 30 minutes of an incident.
- Services, transition-to-operations help. Tell us about your project and we will scope it together; no engagement starts before a written scope is agreed.
Data Center Strategies: "We Build Critical Operations." Building operational capability, not construction. This case study is preparation-only draft material. It promises no certification, no design, no commissioning re-performance, no 24×7 cover, no licensed or energized work, no fixed price, and no zero-outage guarantee.