
Summary: the short version. A hyperscale data center is a data center built at the scale of a very large cloud or internet business: multi-building campuses, run by one operator, serving platforms used by millions of people. There is no single universal threshold that makes a building hyperscale, the commonly cited 100 MW figure is a working shorthand, not a standard.
Synergy Research Group counted 1,360 hyperscale data centers at the end of the fourth quarter of 2025, with hyperscale operators accounting for 48% of worldwide capacity (VERIFIED, Synergy Research Group, 7 April 2026), and projects hyperscale operators will account for 67% of all data-center capacity by 2031 (FORECAST, Synergy Research Group, 7 April 2026).
AI did not invent the hyperscale data center; it changed the load inside halls that already existed, pushing rack density past what air cooling can handle. This guide covers what hyperscale is and is not, what scale buys and what it costs, and how the operation differs at hyperscale.
What hyperscale means, and what it does not
The word "hyperscale" describes the operator's business as much as the building. The hyperscale operators are the small number of very large cloud and internet companies, on the order of twenty firms by the size of their cloud or internet business, whose platforms serve millions of users and whose data-center fleets are measured in gigawatts. That is the first thing to hold on to: hyperscale is a category defined by who operates it and how big their business is, not by a single number on a nameplate.
A 100 MW building run by a small operator is not automatically hyperscale, and a hyperscale operator's smaller building does not stop being part of a hyperscale fleet because it is small.
The counts make the concentration concrete. Synergy Research Group counted 1,360 hyperscale data centers at the end of the fourth quarter of 2025; hyperscale operators account for 48% of worldwide capacity, owning about 60% of that hyperscale capacity themselves and leasing the rest, with non-hyperscale colocation at 20% and enterprise on-premise at 32% (VERIFIED, Synergy Research Group, 7 April 2026).
About 915 hyperscale data centers sit in the known future pipeline (VERIFIED, Synergy Research Group, 19 August 2026), but the pipeline timing is not stated, so do not convert the pipeline count into an annual handover count without a stated delivery assumption. Synergy projects hyperscale operators will account for 67% of all data-center capacity by 2031, with on-premise falling to 19%, and hyperscale capacity doubling in three years (FORECAST, Synergy Research Group, 7 April 2026).
The same forecaster expects US data-center capacity to double in the next three years, with a known pipeline of about 1,500 large data centers worldwide, almost half in the US, representing about 45 GW of IT capacity to be added in the US (FORECAST / pipeline, Synergy Research Group, 23 July 2026), pipeline, not delivered capacity.
Hyperscale is a building type, not a service model. Cloud is the service: computing, storage, and software delivered over the internet, on demand, without the customer owning the building. Hyperscale is the physical plant that makes that service possible at very large scale. A company can run a hyperscale campus that hosts no public cloud at all, and a cloud service can run partly on capacity leased from a colocation provider, in buildings the cloud company does not own. One building can be hyperscale, cloud-hosted, and AI-focused at the same time.
The operator's question is not "is this hyperscale or cloud?" but "who is responsible for what here?", the question Enterprise, Colocation, Hyperscale, Edge: Which Building Are You Actually Operating? compares across all four established facility types. The full plain-language definition is in What Is a Hyperscale Data Center, in Plain Language?.
What AI changed inside halls that already existed
AI did not invent the hyperscale data center. The buildings, the campuses, and the operating model already existed. What AI changed is the load inside halls that already existed, and the load changed fast enough to break assumptions the buildings were designed around.
The change is density. Average rack density in AFCOM's State of the Data Center 2026 survey was 27 kW, up from 16 kW the year before, and average facility size was approaching 38 MW, up from 32 MW (VERIFIED, AFCOM, State of the Data Center 2026, early 2026, survey respondents).
Uptime Institute's Global Data Center Survey 2026 measures density differently, average modal rack density surpassed 11 kW for the first time, with a growing number of operators reporting peak racks of 30 kW or above (VERIFIED, Uptime Institute, Global Data Center Survey 2026, July 2026), so the two figures should not be blended into one number. The direction is the same in both surveys: racks are getting denser, and the densest racks are AI racks.
Dense racks change the physics of the hall. Air cooling has a practical ceiling, and AI racks are past it: air cooling struggles above roughly 30–40 kW per rack, with the same ceiling at about 40–50 kW as an airflow and physics limit, design-dependent (VERIFIED, range across sources, design-dependent). Published air-cooling limits vary, routine air cooling up to about 12–15 kW per rack in one guide, 25–30 kW with good containment in another, so treat any single threshold as design-dependent, not a universal rule.
That is why liquid cooling, cold plates on the processors, a coolant loop carrying the heat to a distribution unit and then outdoors, has moved from a niche to the primary heat path in AI halls. In a direct-to-chip design, the remaining heat, commonly reported as roughly 20–30% of server heat, from memory, drives, network cards, and fans, is still removed by air cooling in the hall (VERIFIED, range, platform-dependent). Do not quote a single fixed split.
And the clock changes with the medium: in a cold-plate liquid-cooled hall, chip thermal limits can be reached in seconds at full load when circulation is lost (VERIFIED). One cited case had CDU pump failure to throttling in as little as 23 seconds, a case-specific figure, never generalized to every hall.
The market direction is forecast, not measured. Goldman Sachs forecast 76% of AI servers would be liquid-cooled by end-2026, up from 15% in 2024 (FORECAST, Goldman Sachs, forecast 2026, month and date unverified via trade press). That forecast date has now passed; whether it landed is checked in the annual review, not assumed here. Treat it as a direction indicator, never as a site fact and never as a present measurement. The liquid-cooling market itself is forecast by Dell'Oro Group to roughly double in 2025 to nearly $3 billion in manufacturer revenue, reaching approximately $7 billion by 2029 (FORECAST, Dell'Oro Group, 2026, month and date unverified via trade press).
Forecasts name their maker and date; they are not measurements of any site. What changes for the operator when cooling is liquid is covered in full in the Liquid Cooling Operations guide.
None of this changed the core model. A hyperscale AI hall still does the same three jobs as any other data center: power in, heat out, nothing down. The power is larger, the heat is more concentrated, and the time available when cooling fails is shorter. What a Data Center Actually Does states the model, and the Data Center Operations guide covers the whole operating job it implies.
What scale buys, and what it costs
What the scale buys, operationally, is standardization. A hyperscale campus is built from repeated designs: the same hall, the same power path, the same cooling arrangement, repeated building after building. That repetition is what makes the operation automatable: a fleet of identical halls can be run with the same procedures, the same spares, the same training, and the same monitoring, and a failure in one hall teaches the operator something about every hall like it.
The trade-off is that a repeated design also repeats its weaknesses: a design error in one hall is a design error in all of them. That is why the handover and first-year discipline matters most at exactly this scale, and why the Transition to Operations guide and the First 12 Months After Turnover guide are the two cluster guides a hyperscale operator should read first. A control sequence that was never exercised at real load will fail identically in every hall that shares it, and a procedure that was never drilled will fail identically on every shift that uses it.
Scale also changes the failure surface in three specific ways.
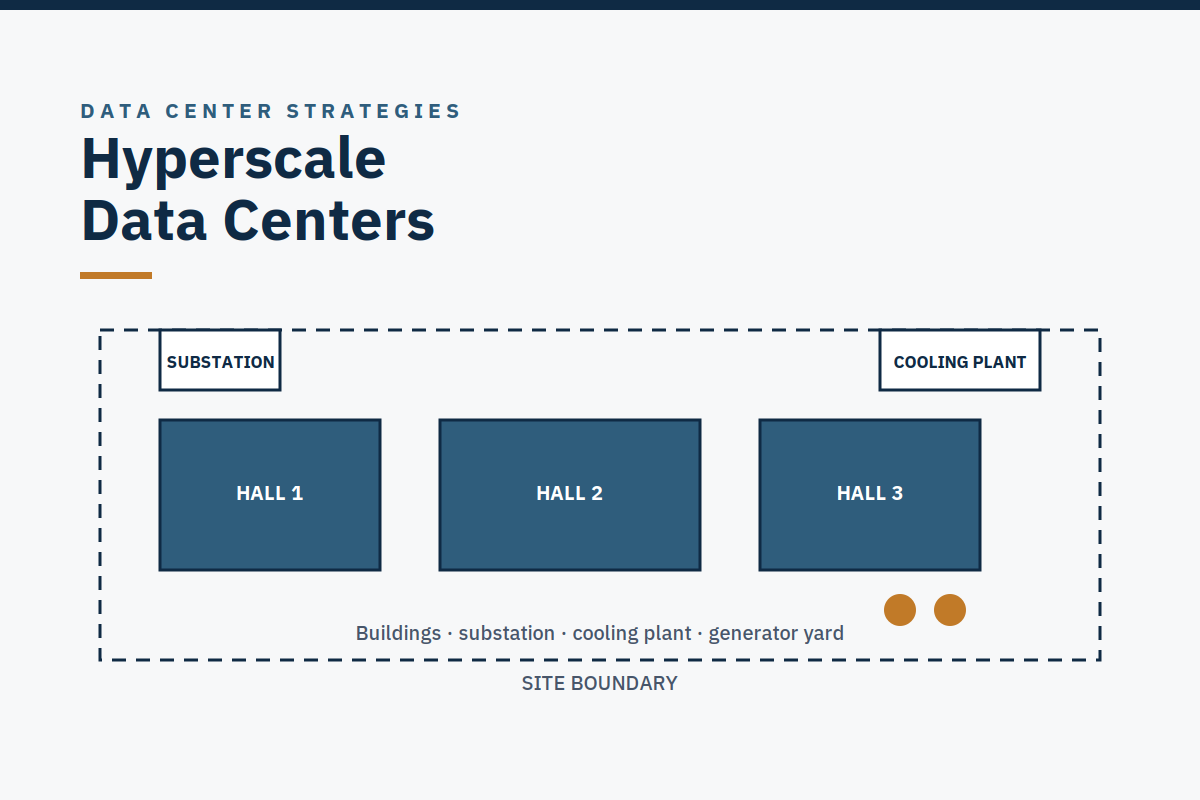
Shared dependencies are campus-level, not hall-level. A campus has one or more buildings plus shared support infrastructure: substations, generators, the cooling plant, and the operations buildings. A shared utility feed or a shared cooling plant is a campus-level dependency that no single hall's redundancy can fix. The operator's first job when something goes wrong is to locate it in the hierarchy, campus, building, data hall, row, rack, server, because "the campus lost utility power" is a different problem from "one hall lost cooling," which is different again from "one rack lost a power feed."
The crew is small relative to the scale, and that is deliberate. Highly standardized and automated operations are part of what makes the model work: the same procedure, the same alarm response, the same maintenance program, applied across dozens of identical halls, watched from one control room. The risk is the mirror image of the benefit. When the operation depends on automation and standardization, the things that break it are the things automation cannot see. A procedure that was never drilled, a sensor that drifted, a control sequence that was never exercised at real load.
Those are the subjects of the operations articles later in the year, and they are the reason this site treats the operator, not the equipment, as the interesting part of the building.
The concentration is the point, and the risk. A small number of very large campuses now carry an outsized share of other people's daily life: the services, the businesses, the hospitals and banks and airlines that run on them. Third-party facilities (colocation, cloud, hosting, SaaS) now handle 46% of enterprise IT workloads versus 44% in corporate-owned data centers, the first time third-party exceeds in-house in Uptime's survey history (VERIFIED, Uptime Institute, Global Data Center Survey 2026, July 2026, over 1,600 participants, April–May 2026).
Almost nobody driving past can see it. That invisibility is part of why the building is so hard to think about, and part of why it matters.
Power, cost, and siting at hyperscale
Hyperscale runs on electricity at a scale that shows up in national statistics. Global data-center electricity was about 415 TWh in 2024 (about 1.5% of global electricity) and about 485 TWh in 2025 (VERIFIED, IEA, Energy and AI, April 2025, and Key Questions on Energy and AI, April 2026). The IEA's base case puts global data-center electricity at about 945–950 TWh by 2030, just under 3% of global electricity, about Japan's annual total, with AI-focused electricity at about 155 TWh in 2025 and about 465 TWh in 2030 (FORECAST, IEA).
Gartner forecasts total worldwide data-center electricity at 565 TWh in 2026, up 26% year-on-year, with AI-optimized servers at about 175 TWh in 2026, up from about 95 TWh in 2025 (FORECAST, Gartner, June 2026, via AI Energy Counter summary). Gartner's universe differs from the IEA's. Do not average the two.
The US forecasts disagree by more than 200 TWh: LBNL (June 2026) puts US data centers at 649 TWh in 2030 (range 521–843 TWh), while the IEA data table puts the US at 426 TWh in the same year. Quote the range and the disagreement, never a single US figure as settled.
The build-out is just as large. JLL forecasts about 97 GW of new capacity to be added 2026–2030, doubling global capacity to about 200 GW, at 14% CAGR through 2030, with up to $3 trillion investment required by 2030 (FORECAST, JLL, 2026 Global Data Center Outlook, 5 January 2026, base case; JLL's own scenarios range 173–200 GW by 2030).
In H1 2026, CBRE counted 7,481 MW under construction across eight primary North American markets, up 24.8% year-on-year, 80.4% preleased, with total supply across those markets growing 33.7% year-on-year to a record 10,903 MW and vacancy at 1.4% (VERIFIED, CBRE, North American Data Center Trends Report, H1 2026, published August 2026). Cushman & Wakefield counted 37.7 GW under construction in the Americas, with 91.7% pre-committed and vacancy at 3.8% (VERIFIED, Cushman & Wakefield, Americas Data Center Update, H1 2026, 14 September 2026).
Never add or average tracker figures that count different universes: CBRE's eight primary wholesale markets are not Cushman & Wakefield's Americas including self-build, and neither is JLL's North America including hyperscaler self-build. Quote one tracker, name its universe, give the figure for that universe only.
Cost follows the same rule. Average global shell-and-core construction cost was $10.7m/MW in 2025, up from $7.7m in 2020, and tenants are typically responsible for tech fit-out, which can cost as much as $25m/MW for AI infrastructure (VERIFIED, JLL, 2026 Global Data Center Outlook, 5 January 2026). The 2026 cost is a forecast: $11.3m/MW (FORECAST, JLL, January 2026). And 2025 data-center capex was $726bn, up 57% year-on-year, with the top-four hyperscalers up 76% in 2025 (VERIFIED as reported, Dell'Oro Group, via Network World, 6 April 2026). Capex is spending, not capacity and not consulting demand.
Siting is where hyperscale meets its neighbors. Power, land, fiber, water, climate, and community decide where a campus can go, and the power-delivery timeline is now one of the longest poles in the tent: the average power-delivery timeline for new large-load requests is 4.4 years (5.0 years Americas/EMEA, 2.7 years APAC) (VERIFIED, Cushman & Wakefield, Global Data Center Market Comparison 2026, published 29 May 2026).
Over half of projects faced delays in 2025 (VERIFIED, JLL, 2026 Global Data Center Outlook, January 2026), as "over half," with no percentage, because the "57% delayed by at least three months" precision is unverified and is not quoted anywhere on this site. Delays are the reason the handover discipline matters: a delayed project compresses integrated systems testing first.
Operating a hyperscale campus: what is different
The core model does not change at hyperscale, and neither do the three jobs. What changes is how the operating job is organized, and the differences are specific enough to name.
Handover happens at a scale the industry has never attempted before. ESTIMATE, bottom-up: CBRE counted 7,481 MW under construction in its eight primary North American markets in H1 2026 (VERIFIED, CBRE, August 2026). Dividing by AFCOM's 2026 survey average facility size of about 38 MW gives roughly 150–375 handover events, with the endpoints assuming average site sizes of about 20–50 MW (central case about 197, at the survey average of about 38 MW) (ESTIMATE, bottom-up). This is our estimate, not a published market size.
Globally, JLL's forecast of about 97 GW of new capacity 2026–2030 works out, on a straight-line average, to about 19 GW a year, roughly 190–500 sites a year, with the endpoints assuming average site sizes of about 38–100 MW (ESTIMATE, straight-line illustration). A hyperscale campus is not 38 MW, and phased energization of one campus over several years counts as several handovers, not one.
Each event is a signing moment with the same risks, and the method for it is the Handover Gate in the Transition to Operations guide. What the Gate catches that a signing party does not is the subject of Case Study 1: Transition-to-Operations Readiness.
The first year is the same shape, at larger consequence. Infant mortality, seasonal transition, and tuning drift are a pattern, not surprises, and at hyperscale the same pattern carries thousands of servers instead of hundreds. The full treatment is in the First 12 Months After Turnover guide and in The First 12 Months. What drifts in the first 12 months is the subject of Case Study 2: Post-Turnover Operational Watch. What buys time when cooling is lost completely at a newly constructed, liquid-cooled AI facility is the subject of Case Study 5: The Cascading Loss of Cooling.
Procedures scale the benefit, and the risk. A fleet of identical halls can be run with the same procedures, the same spares, the same training, and the same monitoring, and a failure in one hall teaches the operator something about every hall like it. The reverse is equally true: a procedure written by someone who never did the task fails identically everywhere it is used. In Uptime Institute's Annual Outage Analysis 2026 (May 2026), failure to follow established procedures was the leading driver of human-error outages at 59% (n=199) (VERIFIED, Uptime Institute, Annual Outage Analysis 2026, May 2026, Fig. 14).
How procedures get good enough to trust at 3 a.m. is the subject of Case Study 4: SOP / MOP / EOP Authorship and Drill Validation. The full method is in the SOP / MOP / EOP guide.
Trend over alarm matters more as the fleet grows. A single hall generates more alarms than one shift can read; a campus of identical halls multiplies the problem. The discipline is the same: rate-of-change and deviation alarms on trended data, one alarm per required action, and a weekly trend review against baselines. Case Study 3: The Silent Compressor Failures shows why: the trend, not the alarm, revealed failures no alarm raised.
Capability is built, not hired. Staffing is the industry's open constraint: 53% of operators report difficulty finding qualified candidates for open roles, up from 46% in 2025 (REPORTED, Uptime Institute, Global Data Center Survey 2026, July 2026, Fig. 17, operators n=607), and 87% of respondents say workforce gaps are affecting operations, up from 85% the year before (REPORTED, AFCOM, State of the Data Center 2026, via executive summary).
At hyperscale the answer is not to hire faster; it is to build system knowledge internally, as a control-room team rather than a collection of single operators. How that works, curiosity, psychological safety, and seeing the whole picture, is the subject of Case Study 6: Building Operator Capability.
Redundancy is a campus question, not a hall question. N, N+1, 2N, 2N+1: Redundancy, and the Maintenance Trap defines the labels, and the maintenance trap applies at every scale: an N+1 plant in maintenance is just N, because the spare is the one being worked on. At hyperscale the trap has a campus form: a shared dependency, one utility feed, one cooling plant, one control network, that no hall's redundancy can fix, and that integrated systems testing never fault-injected. The power path itself, handoff by handoff, is Follow the Electron.
Worked examples: what the case studies show
The pattern in this guide is not theoretical. The six case studies on this site each show one part of operating at scale in practice. Read them for the full accounts; the lesson for this guide is what each one proves about hyperscale operations. No client names, site names, or proprietary details are published in any of them, and the figures labeled illustrative in the case studies stay illustrative here, this guide repeats only the recorded facts and links to the studies rather than restating them.
- Case Study 1: Transition-to-Operations Readiness: a signing party is not a handover, at any scale. Readiness is four pillars, scored, with red lines.
- Case Study 2: Post-Turnover Operational Watch: infant mortality, seasonal transition, and tuning drift are a pattern, not surprises.
- Case Study 3: The Silent Compressor Failures: watch the trend, not the alarm, across identical plants.
- Case Study 4: SOP / MOP / EOP Authorship and Drill Validation: a procedure never drilled fails identically everywhere it is used.
- Case Study 5: The Cascading Loss of Cooling: what buys time when cooling is lost completely at a newly constructed, liquid-cooled AI facility.
- Case Study 6: Building Operator Capability: capability is built internally, as a control-room team.
When to ask for help
Some owners and operators run all of this themselves, with their own team. Others want an independent operator's judgment at the points where the risk concentrates, before the signing moment, through the first year, or when the procedure library needs an outside read. That is what Data Center Strategies' three offers are, in their exact names: Transition-to-Operations Readiness, Post-Turnover Operational Watch: 90-day / 12-month, and Operational Efficiency & Procedure Review.
Each maps to one part of this guide: readiness is the signing moment and the Handover Gate; the watch is the first year; the procedure review is the library and the efficiency opportunities. See the services page for the offers, and the cluster guides for scope, the Transition to Operations guide for readiness, the First 12 Months After Turnover guide for the watch, the SOP / MOP / EOP guide for the procedure review. The Data Center Operations guide is the pillar that ties the three together.
What this help does not do, stated plainly: it does not award or guarantee Tier or M&O certification (only Uptime Institute does that); it does not provide engineering design or a PE stamp; it does not re-perform commissioning or witness or sign commissioning test records; it does not provide 24×7 cover or operate the site; it does not perform or direct licensed or energized work; and it promises no zero-outage guarantee or guaranteed uptime figure. To start a conversation, see the contact page: a short conversation, not a pitch, and no obligation.
Tell us about your project and we will scope it together; no engagement starts before a written scope is agreed. A fixed price is only quoted after scoping, never on a first call.
Questions readers ask
Is my building hyperscale? Probably not, unless a very large cloud or internet company operates it, and the label matters less than the question behind it. What matters is scale of business, multi-building campuses, and standardized, automated operations. If you run one building for one company, the Data Center Operations guide is the guide for you. The operating discipline is the same; only the fleet changes.
Does hyperscale mean the building never goes down? No. Outages are getting less frequent on a per-site basis and more expensive when they happen, and the concentration at hyperscale means each one carries more. No topology, no redundancy label, and no consultancy promises a zero-outage outcome. Tier references are statistical values derived from topology, not contractual guarantees, and "Power In, Heat Out, Nothing Down" is the book's core model, not an uptime guarantee.
Why should a neighbor or a community member care? Because a small number of very large campuses now carry an outsized share of other people's daily life, and because siting decisions, power, land, fiber, water, climate, community, are made years before the first server arrives. The questions to ask are the operator's questions: who is responsible for what, what happens when power or cooling fails, and who is on watch at 3 a.m. The answers to those questions are in the operations guides, not in the marketing material.
Sources
Sources for the figures cited in this guide.
- Synergy Research Group, 7 April 2026, 1,360 hyperscale data centers at end-Q4 2025; hyperscale operators account for 48% of worldwide capacity (own-built about 60%, leased the balance); non-hyperscale colocation 20%; enterprise on-premise 32%; 915 hyperscale data centers in the known future pipeline (Synergy, 19 August 2026; timing not stated); hyperscale operators to account for 67% of all data-center capacity by 2031. Counts VERIFIED; the 2031 share is FORECAST.
- Synergy Research Group, 23 July 2026. US data-center capacity to double in the next three years; known pipeline about 1,500 large data centers worldwide, almost half in the US, representing about 45 GW of IT capacity to be added in the US. FORECAST / pipeline, not delivered capacity.
- AFCOM, State of the Data Center 2026 (10th edition, early 2026), average rack density 27 kW, up from 16 kW the year before; average facility size approaching 38 MW, up from 32 MW. VERIFIED, survey respondents.
- Uptime Institute, Global Data Center Survey 2026 (Keynote Report 209), July 2026: average modal rack density surpassed 11 kW for the first time, with a growing number of operators reporting peak racks of 30 kW or above; third-party facilities now handle 46% of enterprise IT workloads versus 44% in corporate-owned data centers; 53% of operators report difficulty finding qualified candidates (REPORTED, Fig. 17, n=607); industry fleet average PUE 1.52. VERIFIED unless marked REPORTED. Modal density is not AFCOM's average density, do not blend them.
- AFCOM, State of the Data Center 2026, via executive summary, 87% of respondents say workforce gaps are affecting operations, up from 85% the year before. REPORTED.
- Uptime Institute, Annual Outage Analysis 2026 (Keynote Report 201), May 2026, failure to follow established procedures the leading driver of human-error outages at 59% (n=199, Resiliency Survey 2026, Fig. 14). VERIFIED.
- IEA, Energy and AI (April 2025) and Key Questions on Energy and AI (April 2026), global data-center electricity about 415 TWh in 2024 (about 1.5% of global electricity), about 485 TWh in 2025; base case about 945–950 TWh by 2030, just under 3% of global electricity; AI-focused electricity about 155 TWh in 2025, about 465 TWh in 2030. 2024–25 figures VERIFIED; 2030 figures FORECAST (base case).
- Gartner, June 2026, via AI Energy Counter summary, total worldwide data-center electricity 565 TWh in 2026 (up 26% year-on-year); AI-optimized servers about 175 TWh in 2026, up from about 95 TWh in 2025. FORECAST. Gartner's universe differs from the IEA's. Do not average the two.
- LBNL, June 2026. US data centers at 649 TWh in 2030 (range 521–843 TWh, 9.5–15.3% of US electricity). FORECAST; disagrees with the IEA data table (426 TWh) by more than 200 TWh, quote the range and the disagreement.
- JLL, 2026 Global Data Center Outlook, 5 January 2026, about 97 GW of new capacity to be added 2026–2030, doubling global capacity to about 200 GW; average global shell-and-core construction cost $10.7m/MW in 2025 (up from $7.7m in 2020), tech fit-out as much as $25m/MW for AI infrastructure; over half of projects faced delays in 2025; 2026 shell-and-core cost forecast $11.3m/MW. 2025 figures VERIFIED; the 2030 capacity and 2026 cost figures are FORECAST. The "57% delayed by at least three months" precision is UNVERIFIED and is not quoted.
- CBRE, North American Data Center Trends Report, H1 2026, published August 2026, 7,481 MW under construction across eight primary North American markets, up 24.8% year-on-year, 80.4% preleased; total supply 10,903 MW, vacancy 1.4%. VERIFIED.
- Cushman & Wakefield, Americas Data Center Update, H1 2026, 14 September 2026, 37.7 GW under construction in the Americas; 91.7% pre-committed; vacancy 3.8%. VERIFIED.
- Cushman & Wakefield, Global Data Center Market Comparison 2026, published 29 May 2026, average power-delivery timeline for new large-load requests 4.4 years (5.0 years Americas/EMEA, 2.7 years APAC). VERIFIED.
- Dell'Oro Group, via Network World (6 April 2026) and Fibre Systems (11 February 2026), 2025 data-center capex $726bn, up 57% year-on-year; top-four hyperscalers capex up 76% in 2025. VERIFIED as reported.
- Goldman Sachs, forecast 2026, month and date unverified via trade press, 76% of AI servers liquid-cooled by end-2026, up from 15% in 2024. FORECAST, direction indicator only. That forecast date has now passed.
- Dell'Oro Group, 2026, month and date unverified via trade press, liquid-cooling market roughly doubles in 2025 to nearly $3 billion in manufacturer revenue, reaching approximately $7 billion by 2029. FORECAST.
- Data Center Strategies consulting method: the three offers, hard guardrails, claim-labeling rule.
- Case Studies 1–6: Transition-to-Operations Readiness; Post-Turnover Operational Watch; The Silent Compressor Failures; SOP / MOP / EOP Authorship and Drill Validation; The Cascading Loss of Cooling; Building Operator Capability (case studies, November 7, 2026), linked, not duplicated. Case-study figures labeled illustrative in the studies are not repeated here as fact.
Takeaway. Hyperscale means a data center built at the scale of a very large cloud or internet business, multi-building campuses, commonly cited at 100 MW and above, highly standardized and automated, with no single universal threshold that defines it. AI did not invent the hyperscale data center; it changed the load inside halls that already existed, pushing rack density past what air cooling can handle. What scale buys is standardization; what it costs is that every weakness repeats everywhere.
The operation is the same three jobs at larger consequence, and the discipline that holds them is the same: a signed handover, a watched first year, procedures people will actually follow, and a team that knows what normal looks like. Next: the Data Center Operations guide and What Is a Hyperscale Data Center, in Plain Language?.