Summary: the short version. Data center operations is the work of keeping three jobs running without interruption, power in, heat out, nothing down, in a building where the most common failures are operations failures, not design failures. Power remains the leading cause of impactful outages for the fifth consecutive year (VERIFIED, Uptime Institute, Annual Outage Analysis 2026, May 2026), and failure to follow established procedures is the leading driver of human-error outages at 59% (n=199) (VERIFIED, Uptime Institute, Annual Outage Analysis 2026, May 2026, Fig. 14).
This guide covers the whole operating job: the six systems and who owns each, the daily rhythm of rounds and shifts, the people and their authorization, the procedure library, watching trends instead of alarms, redundancy as it actually behaves under maintenance, and the first year after handover. It is the pillar the rest of this site hangs from.
What data center operations actually is
Operations is everything that happens after the building is handed over and before the next one is built. It is not construction, it is not commissioning, and it is not facilities management as a contract line. It is the standing capability, people, procedures, and plant knowledge, that holds the three jobs through every failure, every maintenance window, and every seasonal change.
The three jobs are the test every operations decision has to pass. What a Data Center Actually Does states the model: a data center takes power in, turns it into computation and heat, and gets the heat out, and it must never stop doing any of them. A decision that protects one job by endangering another is not a good decision. Taking a cooling path down for maintenance while the hall is at full load protects the maintenance schedule and endangers the heat-out job.
Deferring a generator test protects the week's plan and endangers the power-in job. Operations is the discipline of never trading one job for another without naming the trade, owning it, and putting a return date on it.
The scale of the risk is not theoretical. In Uptime Institute's Global Data Center Survey 2026 (July 2026), 47% of operators reported an impactful outage in the prior three years, down from 50% in 2025, the sixth consecutive year of decline on a per-site basis (VERIFIED, Uptime Institute, Global Data Center Survey 2026, July 2026).
Outages are getting less frequent, and more expensive: 71% of operators who had an outage said their most damaging outage cost at least $100,000, up from 57% the year before (VERIFIED, Uptime Institute, Global Data Center Survey 2026, July 2026; base: operators who had an outage, not all operators). Uptime itself cautions that outage data should be treated skeptically, because of a lack of transparency and reliable reporting mechanisms (VERIFIED, method note, Uptime Institute, Annual Outage Analysis 2025, May 2025).
The six systems, and who owns each
A data center is six systems that have to work together, and the most common operations failure is treating them as one box. Each system has its own plant, its own failure modes, and its own owner on the shift.
Power. The path from the grid to the chip, in order: utility, substation and transformer, switchgear, generator bus, automatic transfer switch, UPS and batteries with bypass, distribution panels and busway, rack power distribution, server. The full path, handoff by handoff, is Follow the Electron. Two handoffs matter most: the transfer switch to the UPS, and the UPS to the rack.
The UPS is a bridge, not a source, The UPS Is a Bridge, Not a Source, and its batteries are commonly cited as lasting five to fifteen minutes, long enough to bridge to generator start and no longer (VERIFIED, commonly cited range). Among power-related IT service outages, UPS failure is the most commonly cited driver at 39% (n=129) (VERIFIED, Uptime Institute, Annual Outage Analysis 2026, May 2026).
NFPA 110-2025 Type 10 systems must restore power at rated voltage and frequency at the load terminals within 10 seconds of utility failure, with the generator then accepting load in steps, block loading, not full load in 10 seconds (VERIFIED, NFPA 110-2025; no clause number asserted).
Cooling. Heat is captured at the equipment, moved through one or more transfer steps, and rejected outdoors, through chillers, cooling towers, or dry coolers in an air-cooled hall, and through cold plates, a coolant distribution unit, and the facility water system in a liquid-cooled hall. In a cold-plate liquid-cooled hall, chip thermal limits can be reached in seconds at full load when circulation is lost (VERIFIED).
Cooling is about 13% of most-recent impactful outages (VERIFIED, Uptime Institute 2025 analysis), a smaller share than power, but the share that fails fastest. What changes for the operator when cooling is liquid is covered in the Liquid Cooling Operations guide.
Controls. The building management system, the electrical power monitoring system, and the data center infrastructure management layer, the nervous system that senses, alarms, trends, and sequences the other five systems. Loss of the supervisory display is not the same as loss of control: local controllers generally keep running their last programmed logic. But a single shared control system can be a common-mode failure: duplicated power equipment controlled by one PLC pair or one supervisory network can be affected on both sides at once by one wrong command (VERIFIED, design principle).
Fiber. The network that connects the work to the outside world, and the network inside the hall that keeps expensive processors fed with data. Fiber is a supporting system in the core model, not a fourth job, but a fiber failure can stop computation as surely as a power failure.
Fire protection. Detection, suppression, and containment, in layers, and the interfaces between them, where failures actually happen: a coolant leak treated as a cooling event and not as a fire-protection event, aisle containment obstructing sprinklers or gas. Its interfaces are checked at handover, not discovered during an incident.
Physical infrastructure. The building itself: the white space where the IT lives and the gray space that supports it, the security perimeter, and the access control that decides who may touch what. The vocabulary is set out in How to Read a Data Center: campus, building, data hall, row, rack, server.
The operating rhythm: rounds, shifts, handover, maintenance
Operations runs on a rhythm, and the rhythm is the product. Four beats repeat every day, and the quality of the operation is the quality of the beats.
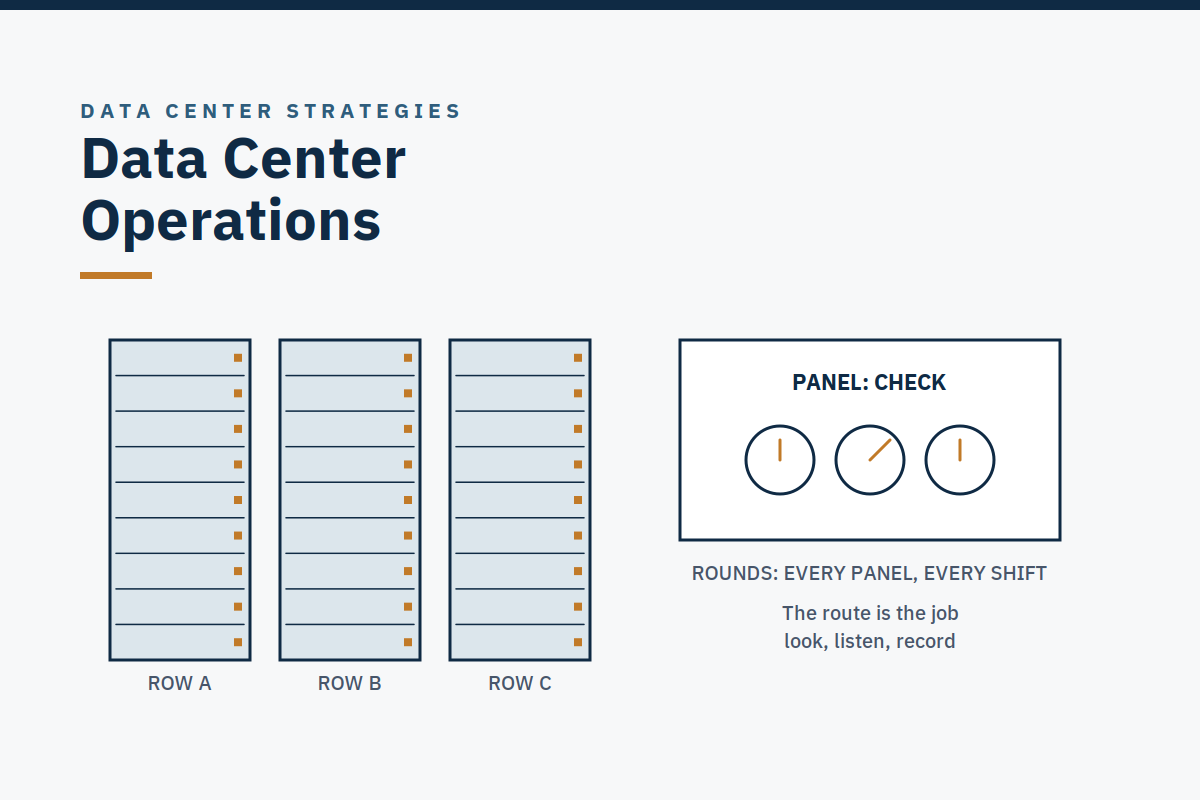
Rounds. The operator walks the plant, substation to one server, gray space to white space, building a mental baseline of what normal looks, sounds, and reads like at each level. Rounds are not sightseeing. They are how abnormal gets noticed before the alarm fires: a pump sounding different, an aisle running warm, a UPS display showing a load that does not match the hall.
Shifts and handover. The site runs 24 hours a day, and the team that holds it changes while the plant does not. Shift handover is a checklist, not a conversation: the actual redundancy state of each system, the work in progress, the alarms that matter, the risks for the next shift.
Maintenance windows. Planned work on critical plant is done under a method of procedure, with numbered steps, expected indications, hold points, a back-out plan, and abort authority, never improvised, never at night as a first-time performance. And every maintenance task ends the same way: a return-to-service verification that proves the plant is back to its designed redundancy state. A UPS left on maintenance bypass after the work is finished, because the return-to-service step was skipped, is one of the most common ways a site silently loses its protection.
The redundancy board. Every shift, the team records the actual redundancy state of each system, N, N+1, 2N, or degraded, and any erosion has a return-to-service date. The plant is 2N on paper and N on a Tuesday afternoon more often than anyone admits: a UPS in maintenance bypass, a bus-tie breaker racked out and never racked back, a coolant loop isolated for a repair and never returned. N, N+1, 2N, 2N+1: Redundancy, and the Maintenance Trap takes up the trap in full.
The Tier references behind the labels are statistical values derived from topology, not contractual guarantees: Tier III (concurrently maintainable) is 99.982%, about 1.6 hours of downtime per year; Tier IV (fault tolerant) is 99.995%, about 0.44 hours (about 26 minutes) per year (VERIFIED, Uptime Institute Tier Standard: Topology). Only Uptime Institute awards Tier. No consultancy can award or guarantee one, and this guide does not promise one.
Underpinning the rhythm is the rota. Sustained overtime at or above 10% "correlates very strongly to increased rates of incidents, including outages and even serious injury or loss of life" (VERIFIED, secondary, practitioner guidance, Uptime Institute, Top 14, February 2021). Staffing is also the industry's open constraint: 53% of operators report difficulty finding qualified candidates for open roles, up from 46% in 2025 (REPORTED, Uptime Institute, Global Data Center Survey 2026, July 2026, Fig. 17, operators n=607). A rota built on vacancies is a rota built on overtime, and overtime is a red line at handover for exactly this reason.
People: staffing, authorization, training, drills
Equipment does not operate itself, and the most expensive plant in the world is only as good as the least experienced authorized person on the night shift. People are the first pillar of readiness for a reason, and they stay the first pillar for the whole life of the building.
Staffing. Enough qualified people, hired early enough to have been present during commissioning, on a rota that works without sustained overtime. The handover doctrine is explicit: the core operations staff should be present during commissioning, not hired after it (VERIFIED, secondary, practitioner doctrine, Future-tech project-acceptance practice, 2020, updated 2024). A team hired after testing is done learns the building while it is already in service.
Authorization. An authorization matrix that names, for every critical task, who is authorized to do it, and no task that depends on one individual. A technician authorized to work in the white space is not automatically authorized to open a switchboard in the gray space, and the matrix is the document that says so.
Authorization is earned by training and drill on this plant, and it lapses without practice: in the consultant's method, EOP authorization lapses after 12 months without a drill of that EOP, and MOP authorization after 12 months without performing or rehearsing it (ESTIMATE, consultant's method). Those periods are the method's, not a standard's.
Training and drills. Training is not a classroom course. It is system training during functional testing, full-facility rehearsals during integrated systems testing, and emergency-procedure drills in the field after energization, walking every emergency operating procedure in the actual hall, with the actual alarms, until the first stabilizing action is fast and certain. A certificate does not prove a technician can run this plant's procedures under load. Only a drill does. And a tabletop is not a drill: a drill injects the fault under controlled conditions and triggers authentic alarms; a walk-through discussion does not.
How operator capability is actually built, curiosity, psychological safety, and seeing the whole picture as a control-room team rather than a single operator, is the subject of Case Study 6: Building Operator Capability.
Procedures: the operating system of the building
If the plant is the hardware, the procedure library is the operating system. SOP vs MOP vs EOP defines the three types: a SOP is how routine work is done, a MOP is a detailed step-by-step plan for one specific job that can affect critical load, and an EOP is the pre-authorized response to a predicted failure mode. The full treatment, ten writing rules, pass/fail quality checks, drill validation, is in the SOP / MOP / EOP guide.
The numbers are the reason this guide puts procedures before equipment. In Uptime Institute's Annual Outage Analysis 2026 (May 2026), failure to follow established procedures was the leading driver of human-error outages at 59% (n=199) (VERIFIED, Uptime Institute, Annual Outage Analysis 2026, May 2026, Fig. 14).
In the Resiliency Survey 2026, 92% of respondents said human error was at least a minor contributor to their most recent impactful outage (VERIFIED, Uptime Institute, Annual Outage Analysis 2026, May 2026, Fig. 13), human error as a contributing factor, not a root cause, and never written as "92% of outages are caused by human error."
A procedure is a decision made in advance, by the people who will live with it, in the order they will use it. The library fails in predictable ways: written by someone who never did the task, copied from another site without checking this site's equipment, never field-validated, never drilled, or never reviewed after a control change.
The quality checks are pass/fail: every state-change step has an expected indication and an "if not seen, do this" branch; hold points are marked before irreversible actions; a back-out plan exists before the first irreversible step; abort authority is named, with the words to stop in the text; and the procedure was field-walked by someone other than its author. A superseded MOP in a drawer is a live hazard. How procedures get good enough to trust at 3 a.m. is the subject of Case Study 4: SOP / MOP / EOP Authorship and Drill Validation.
Watching the plant: trend over alarm
The operator's problem is too much information, not too little. A modern data center generates more alarms than any shift can read, and the discipline is to watch the trend, not the alarm.
Alarm discipline has numbers behind it: an acceptable steady state is below 1 alarm per 10 minutes per operator, and a flood is more than 10 alarms in 10 minutes (VERIFIED, ISA-18.2 and EEMUA 191 / IEC 62682). Every alarm must require a specific operator action within a defined time, one alarm, one required action. A single fault that generates dozens of alarms hides the initiating event, and a genuine new alarm gets missed inside the flood.
Trend over alarm is the corrective discipline: rate-of-change and deviation alarms on trended data, in addition to threshold alarms. A slow drift that never crosses a threshold is still a failure in progress, and in the first year, it usually is one. The clearest demonstration on this site is Case Study 3: The Silent Compressor Failures: the trend, not the alarm, revealed failures no alarm raised.
Taking over, and the first year after
Operations does not begin at handover. It begins before it, and the signing moment is the decision that tests whether the beginning was done properly. What commissioning proves, level by level, is L1–L5 and IST, Explained for the Operator Who Has to Live With the Result. The Signing Moment defines it: four things true at the same time, a complete turnover package, deficiencies closed or formally accepted, people ready, procedures validated, and three possible verdicts: sign, sign with conditions, or do not sign.
The full method, the 27-check Handover Gate and the eight red lines that force "Do not sign" on their own, are in the Transition to Operations guide. What the Gate catches that a signing party does not is the subject of Case Study 1: Transition-to-Operations Readiness.
How many handovers are we talking about? That is an estimate, not a count. ESTIMATE, bottom-up: CBRE counted 7,481 MW under construction in its eight primary North American markets in H1 2026, 80.4% preleased (VERIFIED, CBRE, North American Data Center Trends Report, H1 2026, published August 2026). Dividing by AFCOM's 2026 survey average facility size of about 38 MW gives roughly 150–375 handover events, with the endpoints assuming average site sizes of about 20–50 MW (central case about 197, at the survey average of about 38 MW) (ESTIMATE, bottom-up). This is our estimate, not a published market size.
Signing is not the end of the transition. It is the start of the first year, and the first year has its own shape: a cluster of early failures, the first seasonal cooling transition the plant has never made under real load, chiller tuning problems that only appear at steady-state temperature under the actual operating profile, and a warranty clock that runs out whether or not anyone has used it.
Commissioning continues up to one year post-occupancy, deferred and seasonal testing, optimum-operation adjustment, warranty review, lessons learned, and L6 is post-occupancy and seasonal testing (VERIFIED, Data Center Knowledge / Vertiv, GATE Energy L6 definition). The full treatment is in the First 12 Months After Turnover guide and in The First 12 Months. What drifts in the first 12 months, and how a watch catches it earlier, is the subject of Case Study 2: Post-Turnover Operational Watch. What buys time when cooling is lost completely is the subject of Case Study 5: The Cascading Loss of Cooling.
The first year also teaches the infant-mortality nuance honestly. The USENIX study of about 100,000 disks found "rather than a significant infant mortality effect, we see a significant early onset of wear-out" (VERIFIED, USENIX disk study). For facility equipment, the documented early-failure mechanism is more often design, installation, or startup deficiency and control or calibration error than component bathtub mortality.
New plants see a cluster of early failures from a mix of manufacturing defects, installation errors, and unproven control sequences, which is why burn-in, integrated systems testing, and a first-year watch matter, not that a single bathtub percentage applies. The dated "nearly 70% of early failures" figure is not quoted anywhere on this site.
Efficiency without promises
Operations owns efficiency, and efficiency is measured, not promised. PUE, total facility energy divided by IT energy, must be stated with its measurement boundary, period, IT load, and climate. A PUE quoted without those four is not a number, it is a slogan (VERIFIED, definition and method, The Green Grid / ISO/IEC 30134-2:2026). The industry fleet average PUE is 1.52 (Uptime 2026 survey); modern air-cooled hyperscale runs about 1.1–1.2 (VERIFIED, Uptime Institute Global Data Center Survey 2026).
WUE, annual site water in liters divided by annual IT energy in kWh, has the same rule: any WUE quoted without its boundary and period is not comparable to any other WUE (VERIFIED, The Green Grid, March 2011; ISO/IEC 30134-9:2022). Reported, climate-dependent WUE ranges run from about 0–0.1 L/kWh for a closed-loop or dry-cooler system to about 0.1–0.4 L/kWh adiabatic (VERIFIED, ranges per source).
No one in this guide promises a PUE or WUE figure, a saving, or an uptime figure. Availability figures are statistical expectations from topology, not guarantees, and "Power In, Heat Out, Nothing Down" is the book's core model, not a consulting promise, never present it as an uptime guarantee. The efficiency work an operator can actually do is unglamorous and real: setpoint discipline under change control, staging sequences that do not fight the load, sensor calibration checked before any setpoint is changed, and trends compared against the plant's own baseline rather than a vendor brochure.
Worked examples: what the case studies show
The pattern in this guide is not theoretical. The six case studies on this site each show one part of the operating job in practice. Read them for the full accounts. No client names, site names, or proprietary details are published in any of them, and the figures labeled illustrative in the case studies stay illustrative here, this guide repeats only the recorded facts and links to the studies rather than restating them.
- Case Study 1: Transition-to-Operations Readiness: a signing party is not a handover. Readiness is four pillars, scored, with red lines.
- Case Study 2: Post-Turnover Operational Watch: infant mortality, seasonal transition, and tuning drift are a pattern, not surprises.
- Case Study 3: The Silent Compressor Failures: watch the trend, not the alarm.
- Case Study 4: SOP / MOP / EOP Authorship and Drill Validation: slow, consequence-bearing evolutions, predicting indications aloud, and stopping openly when indications differ.
- Case Study 5: The Cascading Loss of Cooling: what buys time when cooling is lost completely.
- Case Study 6: Building Operator Capability: curiosity, psychological safety, and seeing the whole picture as a control-room team.
When to ask for help
Some owners and operators run all of this themselves, with their own team. Others want an independent operator's judgment at the points where the risk concentrates, before the signing moment, through the first year, or when the procedure library needs an outside read. That is what Data Center Strategies' three offers are, in their exact names: Transition-to-Operations Readiness, Post-Turnover Operational Watch: 90-day / 12-month, and Operational Efficiency & Procedure Review.
Each maps to one part of this guide: readiness is the signing moment and the Handover Gate; the watch is the first year; the procedure review is the library and the efficiency opportunities. See the services page for the offers, and the cluster guides for scope.
What this help does not do, stated plainly: it does not award or guarantee Tier or M&O certification (only Uptime Institute does that); it does not provide engineering design or a PE stamp; it does not re-perform commissioning or witness or sign commissioning test records; it does not provide 24×7 cover or operate the site; it does not perform or direct licensed or energized work; and it promises no zero-outage guarantee or guaranteed uptime figure. To start a conversation, see the contact page. Tell us about your project and we will scope it together; no engagement starts before a written scope is agreed.
Questions operators ask
Who owns a failure that crosses systems, say, a cooling failure caused by a controls fault? The system that failed owns the first action, and the incident lead owns the coordination. That is why every system has a named owner on the shift and why incident-command roles (incident lead, scribe, comms, technical lead) are named and rehearsed before an incident, not during one. The review afterwards asks what in the procedure, the training, or the plant made the outcome likely, not who is to blame.
Can a small team operate a large site? Yes, if the site is standardized enough and the team is authorized, drilled, and rested enough. Highly standardized and automated operations are part of what makes the hyperscale model work, and the same logic applies at any scale: the same procedure, the same alarm response, the same maintenance program, applied consistently. What a small team cannot do is absorb sustained overtime, unwatched systems, or an undrilled procedure library.
Those are the constraints, and they are the same at any size. How scale changes the operation is the subject of the Hyperscale Data Centers guide.
Sources
Sources for the figures cited in this guide.
- Uptime Institute, Annual Outage Analysis 2026 (Keynote Report 201), May 2026, power the leading cause of impactful outages for the fifth consecutive year; failure to follow established procedures the leading driver of human-error outages at 59% (n=199, Fig. 14); UPS failure the most commonly cited driver among power-related outages at 39% (n=129); human error at least a minor contributor to the most recent impactful outage for 92% of respondents. VERIFIED.
- Uptime Institute, Global Data Center Survey 2026 (Keynote Report 209), July 2026, 47% of operators reported an impactful outage in the prior three years (down from 50% in 2025); 56% of respondents who had an outage in the prior three years said power was the primary cause of their most damaging incident (up from 45% in 2025); 71% of operators who had an outage said their most damaging outage cost at least $100,000 (up from 57%); 53% report difficulty finding qualified candidates (REPORTED, Fig. 17, n=607). VERIFIED unless marked REPORTED.
- Human error as at least a minor contributor for 92% of respondents’ most recent impactful outage (Fig. 13), and failure to follow established procedures as the leading driver of human-error outages at 59% (Fig. 14, n=199): Uptime Institute, Annual Outage Analysis 2026, May 2026, Resiliency Survey 2026.
- Uptime Institute's own caution, Annual Outage Analysis 2025: "Data relating to outages should be treated skeptically. All methodologies… are subject to uncertainty, partly because of a lack of transparency and reliable reporting mechanisms." VERIFIED, method note, quoted when quoting outage percentages.
- Uptime Institute, Top 14 (Burgess), February 2021, sustained overtime at or above 10% "correlates very strongly to increased rates of incidents, including outages and even serious injury or loss of life". VERIFIED, secondary: practitioner guidance.
- Uptime Institute Tier Standard: Topology. Tier III reference availability 99.982% (about 1.6 hours of downtime per year); Tier IV 99.995% (about 0.44 hours, about 26 minutes). VERIFIED: statistical reference values, not guarantees.
- NFPA 110-2025. Type 10 systems restore power at rated voltage and frequency at the load terminals within 10 seconds of utility failure; the generator then accepts load in steps (block loading). VERIFIED: no clause number asserted, the standard is paywalled.
- ISA-18.2 and EEMUA 191 / IEC 62682, acceptable steady state below 1 alarm per 10 minutes per operator; a flood is more than 10 alarms in 10 minutes; one alarm, one required action. VERIFIED.
- ASHRAE Guideline 1.6P: see the Transition to Operations guide; at first public review draft in October 2026, not final (VERIFIED, draft status).
- Future-tech project-acceptance practice, 2020, updated 2024, "No responsibility for 'completed' construction areas should be taken on by the site operational management team(s), without the formal acceptance of the project, area or building according to pre-defined criteria… Ideally the core site operations staff should be present during commissioning." VERIFIED, secondary, practitioner doctrine.
- CBRE, North American Data Center Trends Report, H1 2026, published August 2026: 7,481 MW under construction across eight primary North American markets, 80.4% preleased. VERIFIED.
- AFCOM, State of the Data Center 2026 (10th edition, early 2026): average facility size approaching 38 MW. VERIFIED.
- The Green Grid / ISO/IEC 30134-2:2026. PUE definition and method; industry fleet average PUE 1.52 (Uptime 2026 survey). VERIFIED.
- The Green Grid, March 2011; ISO/IEC 30134-9:2022. WUE definition; reported climate-dependent ranges about 0–0.1 L/kWh closed-loop or dry-cooler, about 0.1–0.4 L/kWh adiabatic. VERIFIED.
- Data Center Knowledge / Vertiv; GATE Energy (L6 definition), commissioning continues up to one year post-occupancy; L6 is post-occupancy / seasonal testing. VERIFIED.
- USENIX disk study (about 100,000 disks), "rather than a significant infant mortality effect, we see a significant early onset of wear-out". VERIFIED.
- Data Center Strategies consulting method, the three offers, hard guardrails, claim-labeling rule, Handover Gate §2.1, Watch §2.2, Procedure Review §2.3.
- Case Studies 1–6: Transition-to-Operations Readiness; Post-Turnover Operational Watch; The Silent Compressor Failures; SOP / MOP / EOP Authorship and Drill Validation; The Cascading Loss of Cooling; Building Operator Capability (case studies, November 7, 2026), linked, not duplicated. Case-study figures labeled illustrative in the studies are not repeated here as fact.
Takeaway. Operations is the standing capability that holds three jobs, power in, heat out, nothing down, through every failure, every maintenance window, and every seasonal change. It is six systems with a named owner each, a rhythm of rounds and shifts and return-to-service checks, people who are authorized and drilled on this plant, and a procedure library written by someone who did the task and validated in the field.
The outages that still happen are dominated by how the building is operated, not how it was designed, and how a building is operated is the one thing the operations team controls. Next: the Hyperscale Data Centers guide and the Transition to Operations guide.